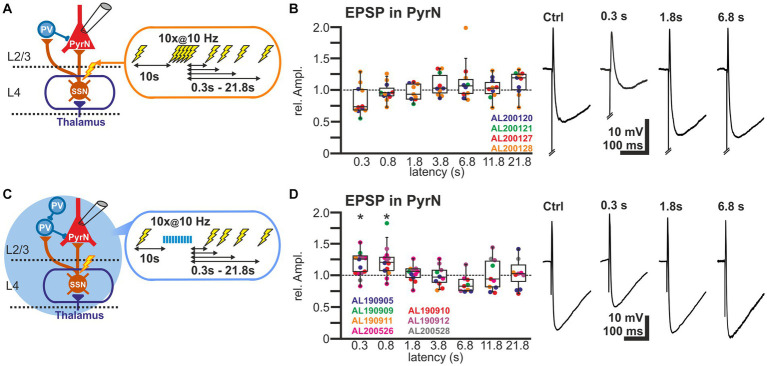
Figure 5.
Short-term plasticity of stimulus-induced EPSPs in L2/3 pyramidal neurons. (A) Schematic representation of recording and stimulation condition used for the experiment shown in panel (B). Each stimulation protocol consists of a control stimulus, followed by a burst stimulation and test stimuli applied between 0.3 and 21.8 s after the burst. (B) Boxplot illustrating the relative EPSP amplitudes, as compared to the control EPSPs, at different latencies after the burst. No significant alterations in the amplitudes were observed. In the right panels, typical voltage traces are displayed. Note that the initial short EPSP was followed by long-lasting hyperpolarization. (C) Schematic representation of recording and stimulation condition used for the experiment shown in panel (D). Each stimulation protocol consists of an electrical control stimulus, followed by an optogenetically induced burst stimulation and subsequent electrical test stimulus applied between 0.3 and 21.8 s after the burst. (D) Relative amplitude of the EPSPs at different latencies after the optogenetically induced burst. Note the significant increase in the EPSP amplitude 0.3 and 0.8 s after the burst. In the right panels typical current traces are displayed. Note the increased amplitude of EPSPs at latencies of 0.3 and 0.8 s after the burst and the decreased hyperpolarization 0.3 s after the burst. Significance in panel (B,D) is indicated by *p < 0.05.

