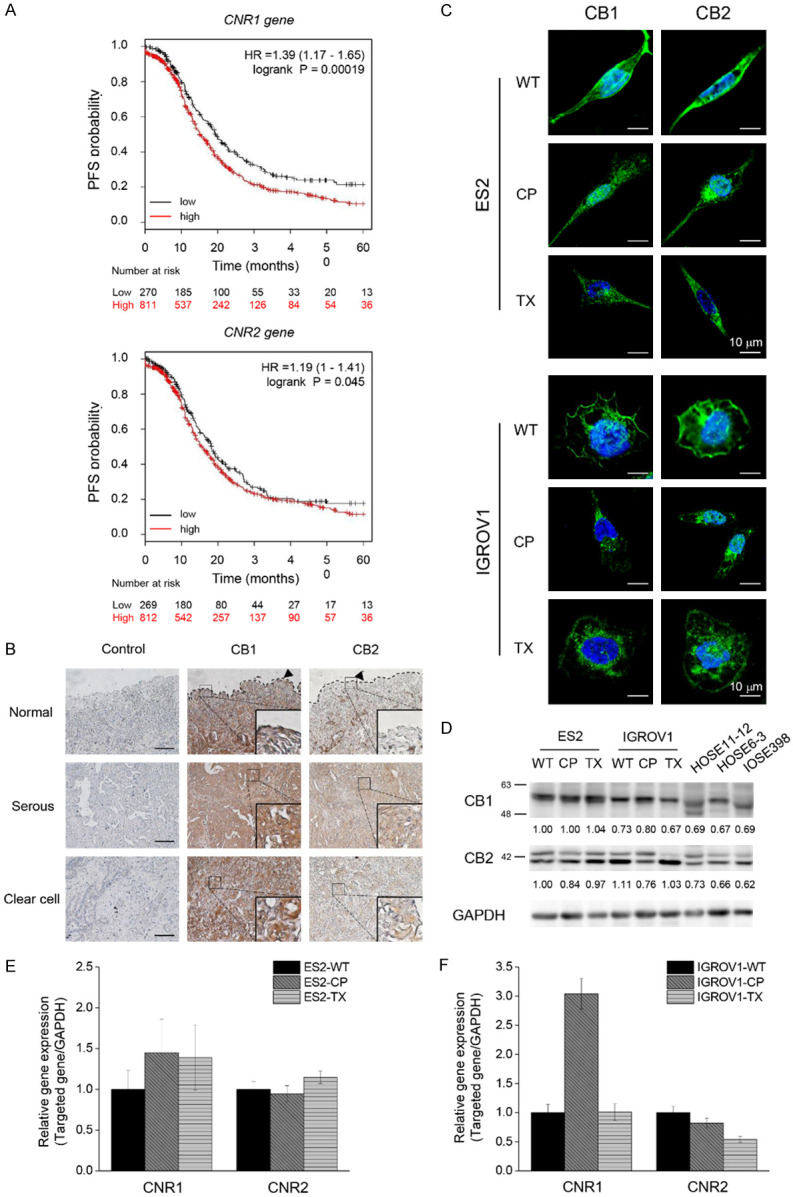
Figure 1.

Existence of CB1 and CB2 in OVC. A. Kaplan-Meier plots showed the high and low expression levels of CNR1 and CNR2 genes in OVC cohort study. Log rank p-value and hazard ratio (HR) are shown in the figures. B. Representative images of CB1 or CB2 immunoreactivity in ovarian tissues. Images of serum control were presented on the left panel. In the middle and the right panels, brown color intensity represented the expression of CB1 and CB2. Enlarged images were shown in the lower right corner. Dotted lines displayed the location of normal epithelium. Scale bars, 100 μm. C. Representative images taken by confocal microscopy showed that both ES2 and IGROV1 cell lines expressed CB1 and CB2 (green). Nucleus was stained by Hoechst dye (blue). D. Comparison of CB1 and CB2 Western blotting between cancer cell lines (ES2 and IGROV1) and normal cell lines (HOSE11-12, HOSE6-3, IOSE398). GAPDH was served as the internal control. E, F. CNR1 and CNR2 mRNA expression levels in OVC cells. The Ct value of CNR1 and CNR2 was compared to GAPDH mRNA level in each cell line, and the comparative Ct value of CNR1 and CNR2 in chemoresistant cells was normalized with wild-type cells. The Y axis showed the fold change of CNR1 and CNR2 mRNA expression levels between wild-type and chemoresistant cells. The experiments were repeated for at least three times. Bars represent mean ± SEM. WT: wild-type, non-chemoresistant cell line, CP: cisplatin-resistant cell line, TX: paclitaxel-resistant cell line.
