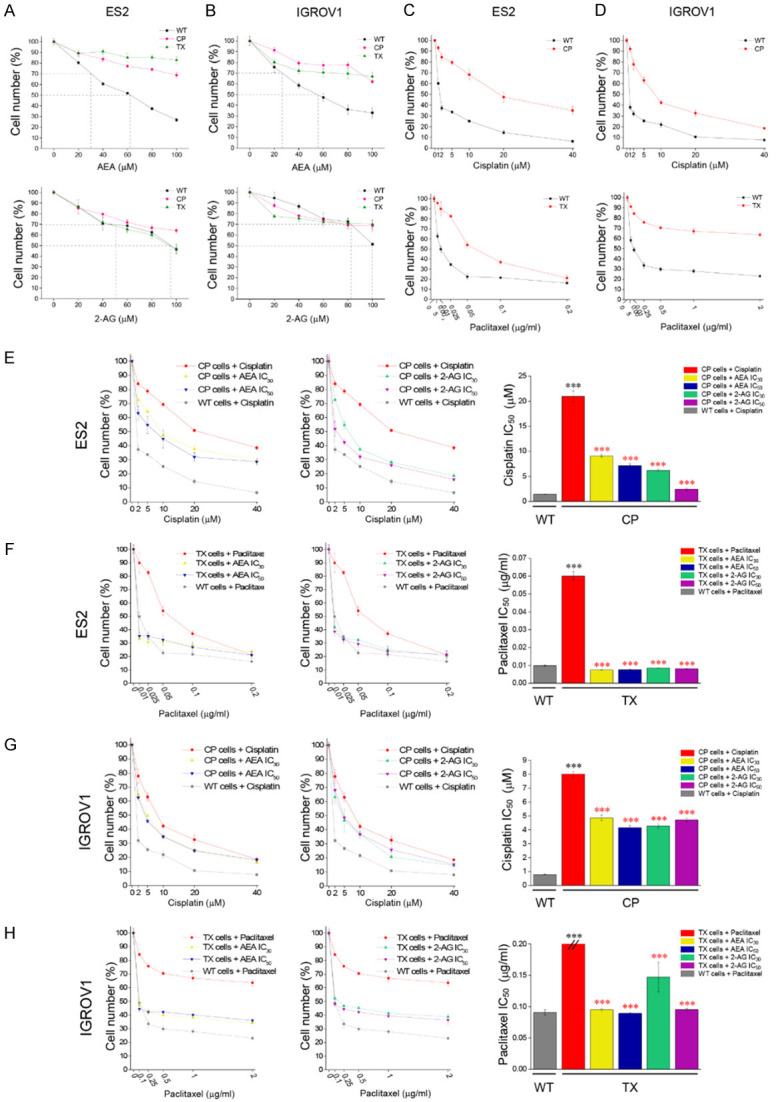
Figure 2.

Cell toxicity of endocannabinoids and chemotherapeutic drugs on OVC cell growth. A, B. AEA and 2-AG were treated for 48 h at 0-100 μM on ES2 and IGROV1 cell lines. C and D. Cisplatin (0-40 μM) and paclitaxel (0-0.2 μg/mL) were treated for 48 h on both ES2 and IGROV1 cell lines. E-H. Different concentration of cisplatin or paclitaxel were combined with endocannabinoids to treat both ES2 and IGROV1 cell lines. In the left and middle images, red solid line represents CP- or TX-resistant cell lines. Yellow/blue or green/purple solid lines represent the addition of IC30 or IC50 values of AEA or 2-AG respectively on cisplatin- or paclitaxel-resistant cell lines. Gray dotted line represents wild-type cell line. In the right panels, IC50 values of cisplatin or paclitaxel were analyzed and compared between wild-type or chemoresistant cell lines. Black asterisk symbolized the IC50 comparison between wild-type and resistant cell lines, while red asterisk represented the IC50 comparison between the treatment of chemotherapeutic drugs alone and combined treatments with several conditions in resistant cell lines. ***P<0.001 by one-way ANOVA. All experiments were repeated for three independent experiments. Bars represent mean ± SEM.
