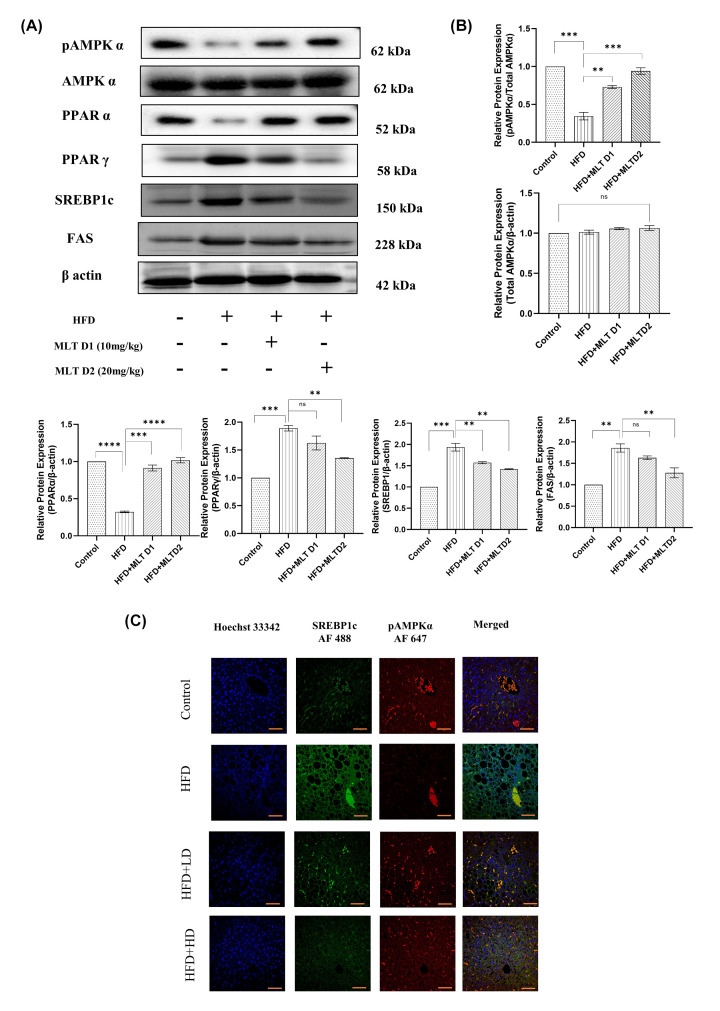
Figure 10. In vivo lipogenic markers altered following melatonin administration.
Melatonin re-established lipogenic protein levels. (A) Western blot analysis of pAMPKα, Total AMPKα, PPARα, PPARγ, SREBP1c and FAS. (B) Bar graphs show the quantification of total AMPKα /β-Actin, pAMPKα/total AMPKα, PPARα/β-Actin, PPARγ/β-Actin, FAS/β-Actin, and SREBP1c/β-Actin, respectively. (C) Immunofluorescence images of expression of pAMPKα and SREBP1c; scale bar: 40 µm. Data are represented as the mean percentage ± SEM (n=3); ****P<0.0001, ***P<0.001, **P<0.01, *P<0.05; ns, non-significant.

