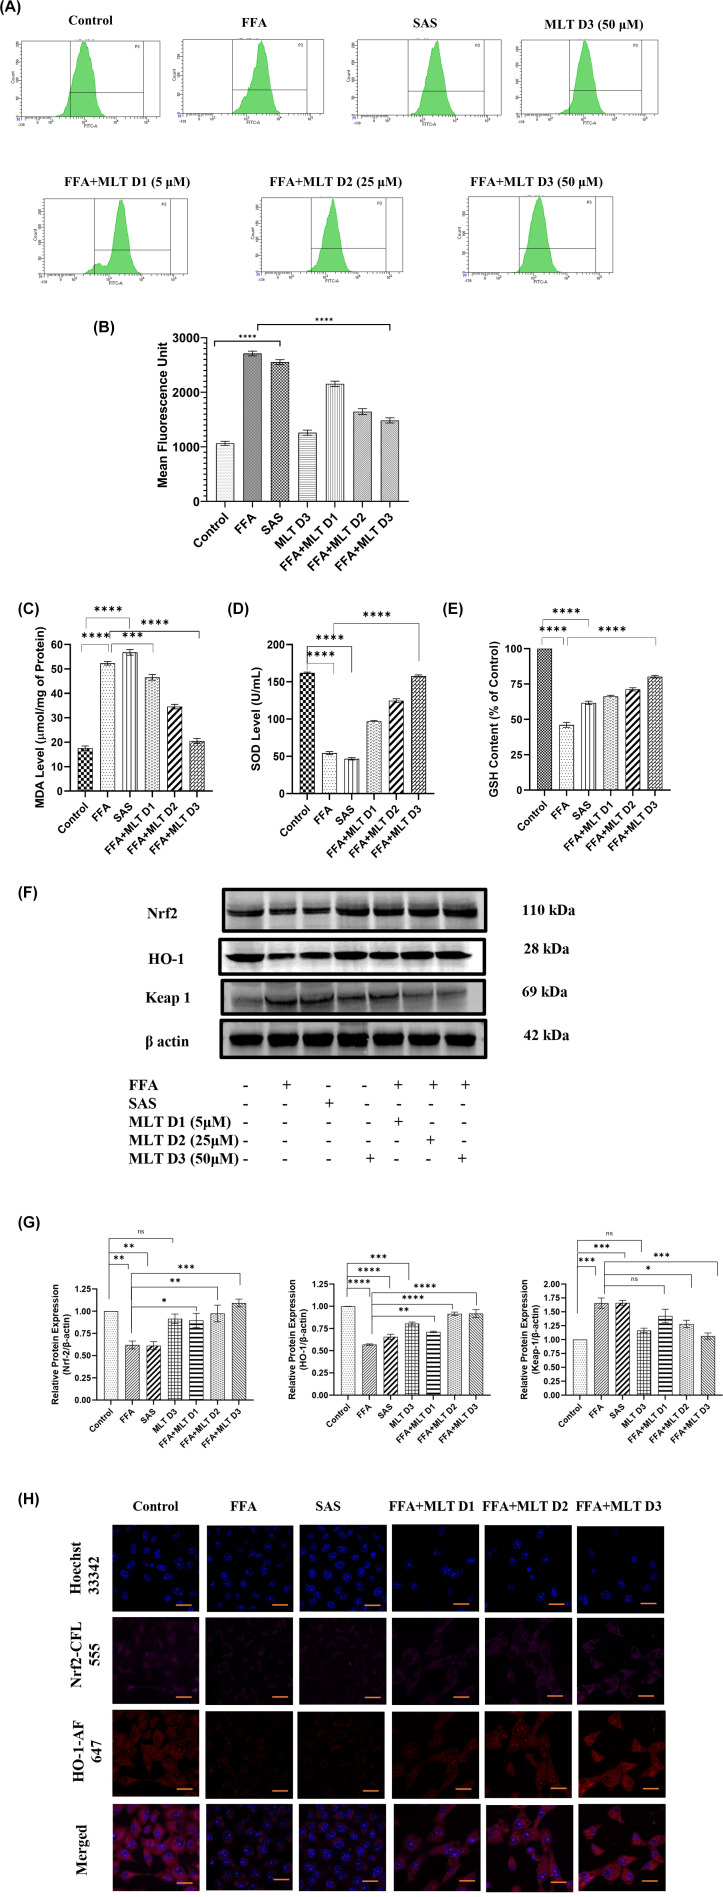
Figure 3. Melatonin recovers HepG2 cells from FFA-induced ferroptosis via modifying Nrf2/HO-1 mediated signaling.
Qualitative and quantitative analysis of intracellular oxidative status and involvement of Nrf2/HO-1 pathway in NAFLD-related ferroptosis. (A) Flow cytometric analysis of ROS generation in different treatment groups using DCFDA, and (B) bar graph represents mean fluorescence unit of ROS levels in different groups. Panels (C–E) represent MDA, SOD and GSH content in different treated groups. (F) Western blot analysis of Nrf2, HO-1 and Keap-1. (G) Bar graphs show the quantification of Nrf2/β-Actin, HO-1/β-Actin and Keap-1/β-Actin, respectively. (H) Representative immunofluorescence images shown Nrf2 and HO-1 expression in HepG2 cells depending on different treatments; scale bar: 50 µm. Data are represented as the mean percentage ± SEM (n=3); ****P<0.0001, ***P<0.001, **P<0.01, *P<0.05; ns, non-significant.

