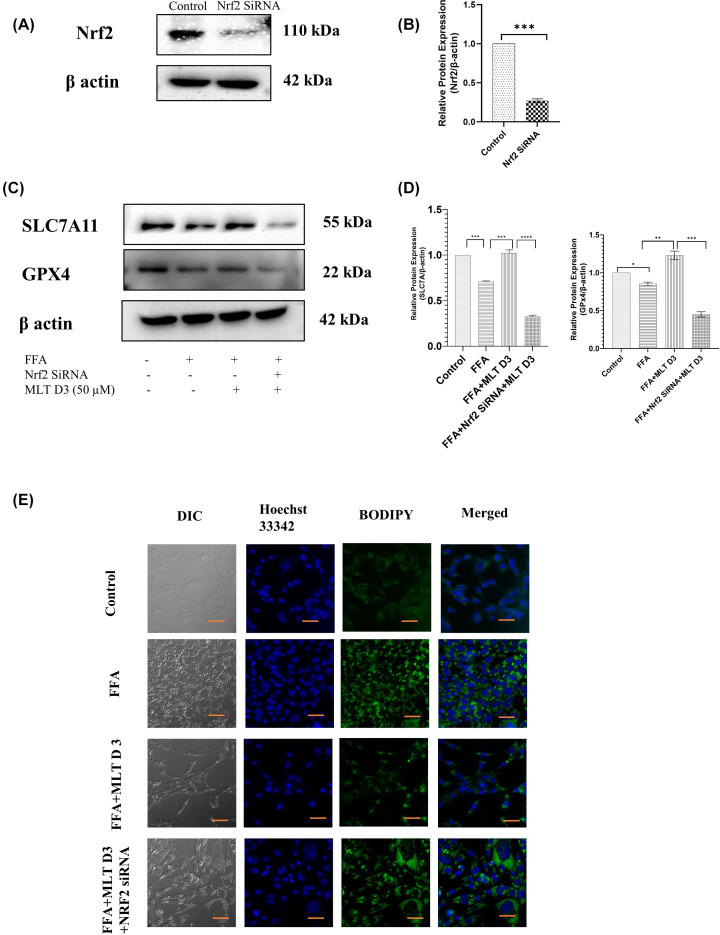
Figure 4. Melatonin recovers HepG2 cells from FFA-induced ferroptosis via modifying Nrf2/HO-1-mediated signaling.
SLC7A11 and GPX4 expression was verified using Nrf2 Si-RNA transfection. (A) Western blot analysis of Nrf2 in control and SiRNA-treated groups. (B) Bar graphs show the quantification of Nrf2/β-Actin. (C) Western blot analysis of SLC7A11 and GPX4. (D) Bar graphs show the quantification of SLC7A11/β-Actin and GPX4/β-Actin, respectively. (E) Immunofluorescence images of HepG2 cells of different treated groups using BODIPY; scale bar: 50 µm. Data are represented as the mean percentage ± SEM (n=3); ****P<0.0001, ***P<0.001, **P<0.01, *P<0.05; ns, non-significant.

