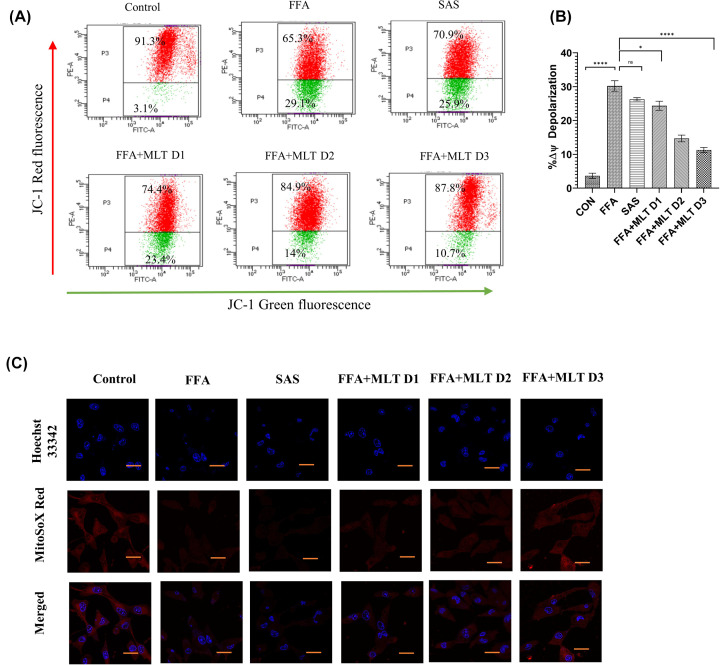
Figure 5. Melatonin controlled mitochondrial environmental changes during ferroptosis: changes in mitochondrial membrane potential and mitoROS.
(A) Flow cytometric analysis of mitochondrial membrane potential using JC1 in different treatment groups. (B) Bar graph represents percentage changes of depolarization of mitochondrial membrane potential. (C) Immunofluorescence images of mitochondrial superoxide content using MitoSoX. Data are represented as the mean percentage ± SEM (n=3); ****P<0.0001, ***P<0.001, **P<0.01, *P<0.05; ns, non-significant.

