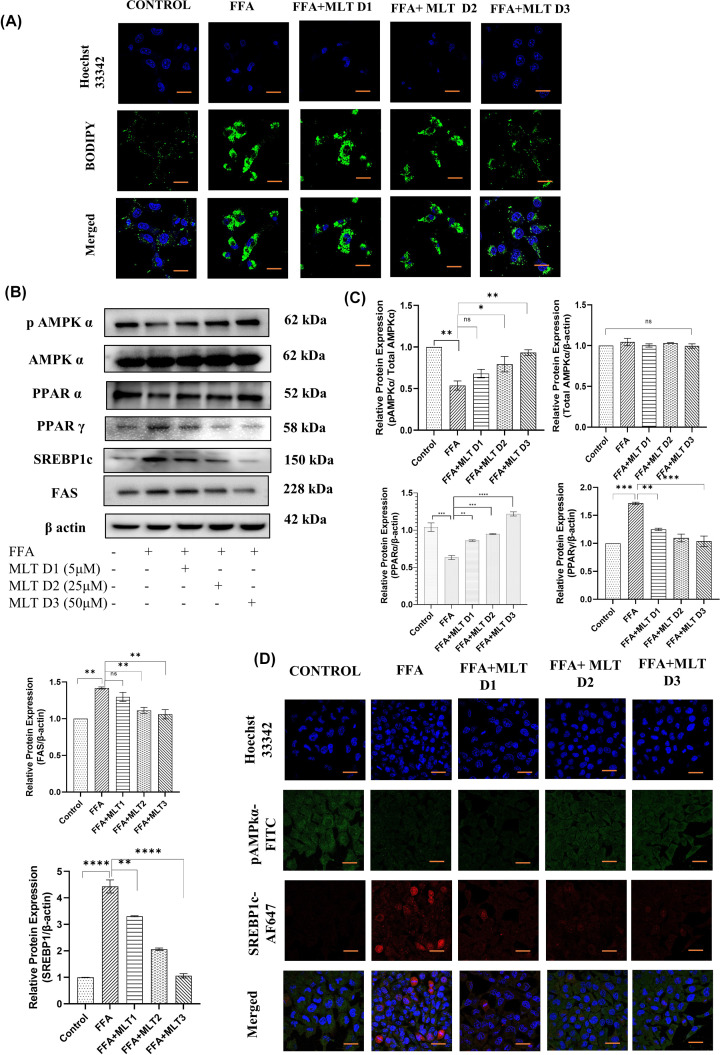
Figure 6. Melatonin inhibited metabolic markers associated with lipogenesis in vitro.
Analysis of lipid ROS and potential lipogenic markers. (A) BODIPY staining of HepG2 cells treated with FFA and different doses of MLT. (B) Western blot analyses of pAMPKα, total AMPKα, PPARα, PPARγ, SREBP1c and FAS are shown. (C) Bar graphs show the quantification of total AMPKα/β-Actin, pAMPKα/Total AMPKα, PPARα/β-Actin, PPARγ/β-Actin, FAS/β-Actin and SREBP1c/β-Actin, respectively. (D) Immunofluorescence images of expression of pAMPKα and SREBP1c; scale bar: 50 µm. Data are represented as the mean percentage ± SEM (n=3); ****P<0.0001, ***P<0.001, **P<0.01, *P<0.05; ns, non-significant.

