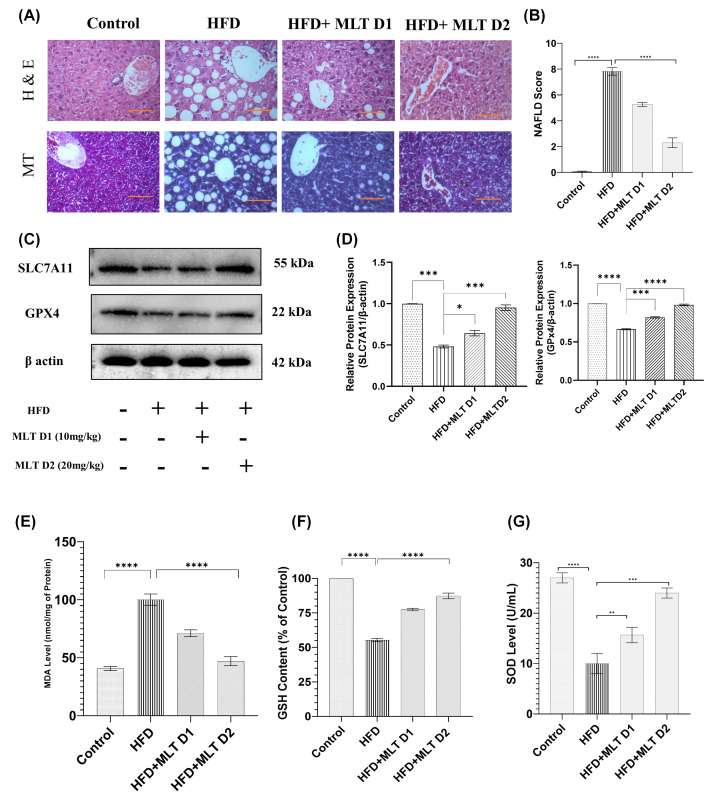
Figure 8. Melatonin augmented recovery from NAFLD in C57BL/6 mice.
Modulation of NAFLD-mediated histopathological and biochemical changes. (A) H&E and MT staining of HFD and MLT treated mice groups; scale bar = 40 µm. (B) Bar graph shows the NAFLD score. (C) Western blot analysis of SLC7A11 and GPX4. (D) Bar graphs show the quantification of SLC7A11/β-Actin and GPX4/β-Actin respectively. (E–G) Bar graph represents MDA level, GSH content and SOD level analyzed using Tissue lysates. Data are represented as the mean percentage ± SEM (n=3); ****P<0.0001, ***P<0.001, **P<0.01, *P<0.05; ns, non-significant.

