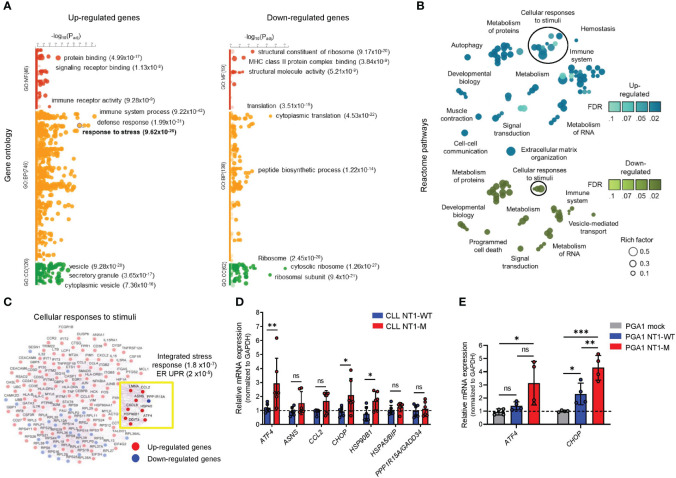
Figure 1.
ER UPR markers are enriched in NOTCH1-mutated CLL cells. (A) Gene Ontology enrichment analysis of up- (left panel) and downregulated DEGs (right panel) in NT1-M versus NT1-WT CLL samples, with three of the most significant pathways for MF, BP, and CC shown next to the dots with their P-values. “Response to stress” is represented by the highlighted circle, and its P-value is shown in bold. MF: molecular function; BP: biological process; CC: cellular component. (B) The bubble plot show enriched Reactome pathways for upregulated DEGs (blue, upper panel) and downregulated DEGs (green, bottom panel). For each pathway, the false discovery rate (FDR) is represented by shading, and the rich factor (ratio of the number of DEGs annotated in a pathway to the number of all genes annotated in this pathway) is represented by bubble size. Groups of related pathways are labeled with a general descriptive term as opposed to individual pathway names. (C) The gene interaction network of genes involved in “cellular responses to stimuli” shows the co-expression (represented by purple edges) among up- (red nodes) and downregulated (blue nodes) DEGs. Genes highlighted in the yellow box are enriched in the integrated stress response (1.8 × 10⁻⁷) and ER UPR (2 × 10⁻⁵). (D) Bar graphs with data points show the gene expression of ER/UPR markers, assessed by qPCR, in NT1-M CLL primary cells (N = 6) compared with NT1-WT (N = 6). mRNA levels were normalized to GAPDH and are represented as fold change using NT1-WT cells as a reference set to 1 (dashed line). Data are presented as mean ± SD. *P< 0.05, **P< 0.01; ns, not significant as determined by the Mann–Whitney unpaired test. (E) Bar graphs with data points show the gene expression of the ER/UPR markers ATF4 and CHOP in PGA1 cells transduced with NICD-mutated and NICD WT fragment of four independent tests. mRNA levels were normalized to GAPDH and are represented as fold change by using PGA1 with an empty vector (mock) as a reference set to 1 (dashed line). Data are presented as mean ± SD. *P< 0.05, **P< 0.01, ***P< 0.001; ns, not significant as determined by using one-way ANOVA (Geisser–Greenhouse correction).

