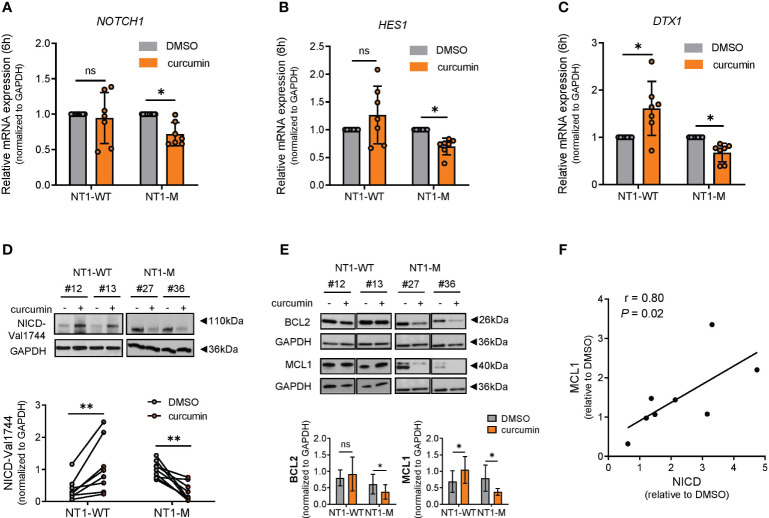
Figure 4.
NOTCH1 is downregulated by curcumin in NT1-M cells and correlates with MCL1 expression. (A) Bar graphs with data points show the gene expression of NOTCH1 mRNA expression in NT1-WT and NT1-M (N = 7 for both) assessed by qPCR, after 6 h of 15 μM curcumin or DMSO (0.05%) treatment. (B, C) Bar graphs with data points show the gene expression of NOTCH1 downstream targets HES1 and DTX1, after 6 h of curcumin or DMSO treatment (N = 7). mRNA levels were normalized to GAPDH and are represented as fold change by using the DMSO control as a reference set to 1. (D) Representative Western blot (top) and dot-and-line diagram (bottom) analysis of NICD-Val1744 in NT1-WT and NT1-M CLL cells (N = 8 and N = 9, respectively) incubated with DMSO (0.05%) or 15 μM curcumin for 24 h. (E) Representative Western blot (top) and bar graph (bottom) analysis of MCL1 (N = 7, both groups) and BCL2 protein levels (N = 6, both groups), after 24 h of curcumin or DMSO exposure. (F) Correlation analysis between NICD-Val1744 and MCL1 expression in NT1-WT cells after treatment. Data are presented as mean ± SD. (A–E) *P< 0.05, **P< 0.01; ns, not significant as determined by Wilcoxon paired test. (F) The correlation between MCL1 and NICD values was assessed by Spearman’s correlation test (r).

