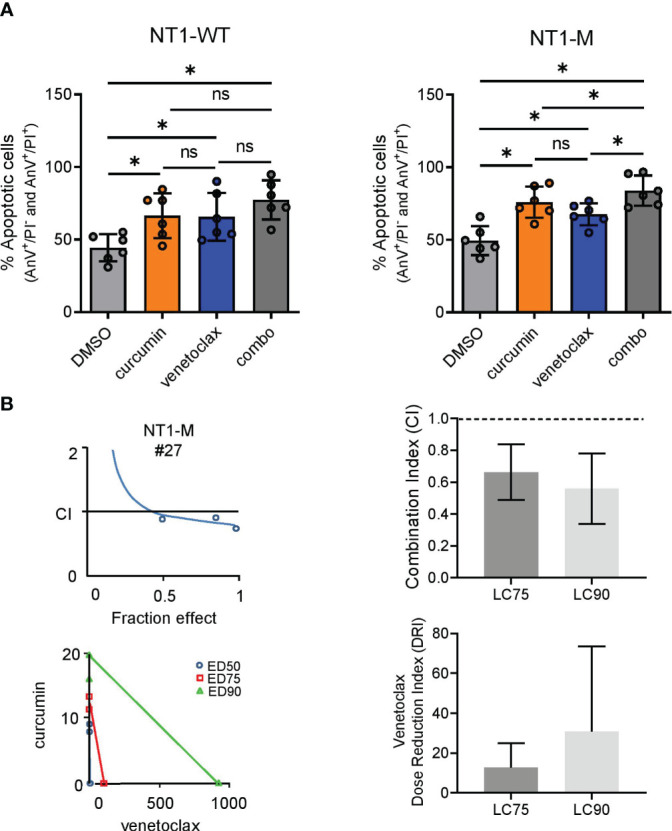
Figure 5.

Venetoclax synergizes with curcumin in NT1-M CLL cells. (A) AnV/PI assay was used to assess the percentage of apoptotic (early plus late) NT1-WT and NT1-M (N = 6, for both) CLL cells treated for 24 h with curcumin (15 μM), venetoclax (2 nM), curcumin/venetoclax combination, or DMSO (0.05%) as control. Data are presented as mean ± SD. *P< 0.05; ns, not significant as determined by Wilcoxon paired test. (B) CI curves and isobolograms computed by the Chou–Talalay model (CalcuSyn software, Biosoft, Cambridge) from the dose–effect profiles of activated leukemic cells treated for 24 h with increasing concentrations of curcumin (7.5–30 μM), venetoclax (1–4 nM), or venetoclax/curcumin at a constant ratio (1:7.5). CI measures drug interaction effects: additive: 0.9 ≤ CI ≤ 1.1; synergism: CI< 0.9; and antagonism: CI > 1.1. Isobolograms: the x- and y-axes represent the doses of venetoclax and curcumin, respectively. The intercepts of the three lines on the x- and y-axes represent the dose of the same efficacy when the two drugs are used alone, which are here expressed as half, 75%, and 90% effective doses (i.e., ED50, ED75, and ED90, respectively). Additive: point on the line; synergism: point below the line; antagonism: point above the line. CI values at the “fractional effect levels” LC75 and LC90 (concentrations lethal to 75% and 90% of CLL cells, respectively). The dotted lines indicate CI = 0.9 and CI = 1.1. Data are presented as mean ± standard deviation (SD). *P< 0.05; ns, not significant as determined by using one-way ANOVA (Geisser–Greenhouse correction).
