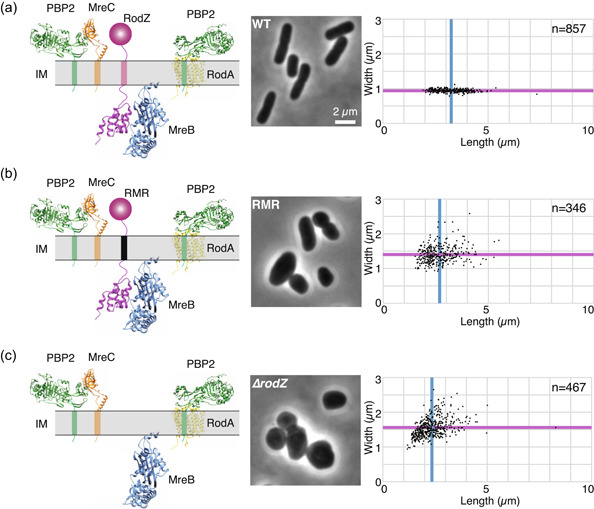
Figure 1.

Morphology of cells producing mutant Rod complex. (a–c) Schematic illustrations of Rod complex containing WT RodZ (a, left) or RMR (b, left) and Rod complex without RodZ (∆rodZ) (c, left). For the structure of each protein, we used the structures registered in the database (https://alphafold.ebi.ac.uk) of proteins predicted by Alpha Fold2 (Jumper et al., 2021). IM, inner membrane. Morphology of cells producing WT RodZ (a, middle and right) or RMR (b, middle and right) and cells lacking rodZ (c, middle and right) and distribution of length and width of each strain (right). Phase contrast images are shown (middle). Blue and magenta lines indicate the average length and width of WT cells, respectively.
