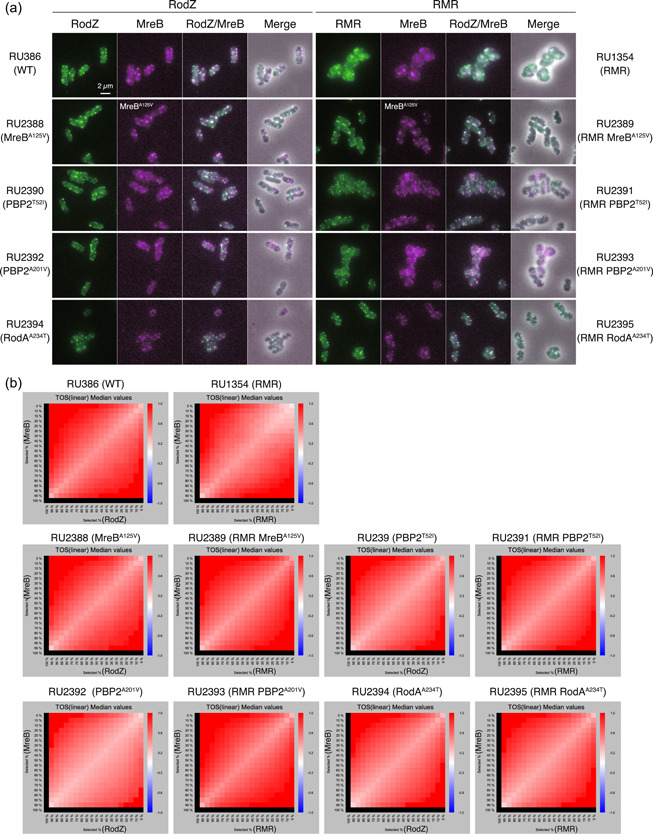
Figure A3.

Colocalization of MreB and RodZ or RMR in cells producing each suppressor. (a) Cells producing MreB‐mCherrySW and sfGFP‐RodZ or sfGFP‐RMR were grown to log‐phase in L medium at 37°C. Fluorescent and merged images are shown. (b) Quantitative analyses of colocalization of MreB‐mCherrySW and sfGFP‐RodZ or sfGFP‐RMR. Metric matrixes for the threshold overlap score (TOS) (linear scaling) for each strain are shown.
