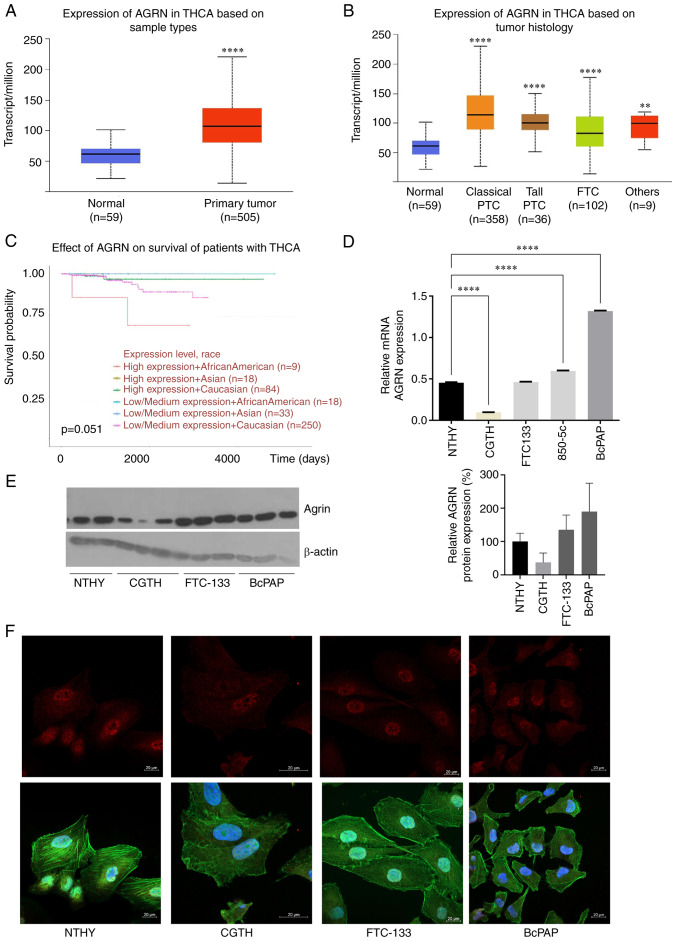
Figure 1.
AGRN is overexpressed in TC. (A) AGRN expression in TC (n=505) vs. normal thyroid tissue (n=59). (B) AGRN expression in THCA subtypes. The plot shows analysis of the TCGA THCA cohort data performed using UALCAN. **P<0.005, ****P<0.0001 vs. normal. (C) Expression of AGRN is associated with survival of patients with TC. The analysis was performed using UALCAN. (D) Reverse transcription-quantitative PCR analysis of AGRN mRNA expression in cell lines derived from NTHY and TC (CGTH, FTC-133 and BcPAP). Expression was analyzed in RNA isolated from one cell culture plate/cell line and three technical replicates ****P<0.0001. (E) Western blotting of AGRN protein expression in cell line derived from NTHY and TC (CGTH, FTC-133, BcPAP). Western blotting was performed on three biological replicates using monoclonal mouse anti-human AGRN antibody. The plot shows changes in AGRN protein expression normalized to β-actin. (F) Representative images of AGRN immunostaining in cell lines derived from TC (AGRN, red; phalloidin-FITC, green and DAPI, blue). Scale bar, 20 µm. TC, thyroid cancer; TCGA, The Cancer Genome Atlas; AGRN, agrin; THCA, thyroid carcinoma; UALCAN, University of Alabama at Birmingham Cancer Data Analysis Portal; PTC, papillary thyroid carcinoma; FTC, follicular thyroid carcinoma.

