
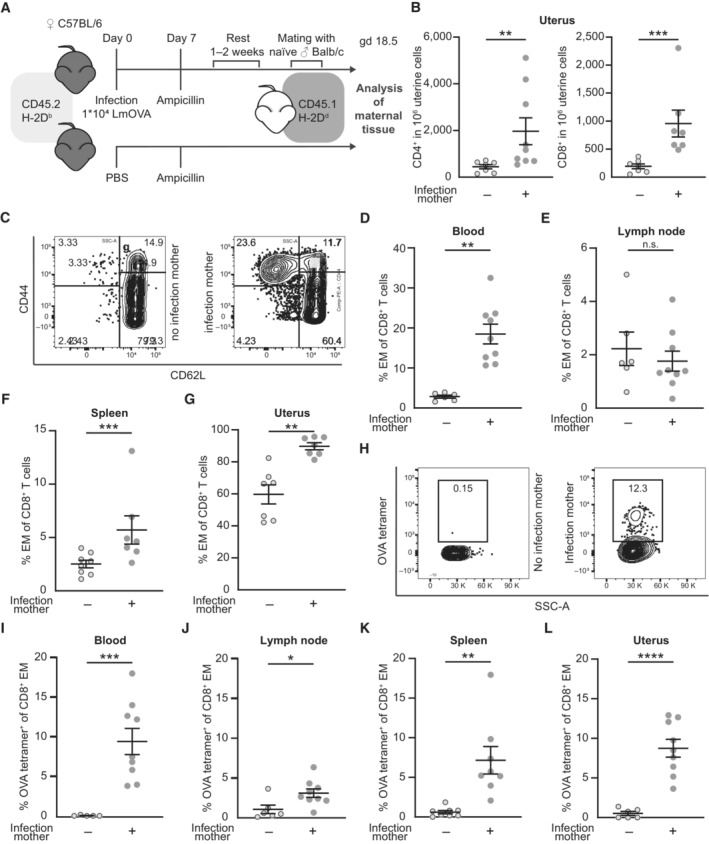
Figure 1. LmOVA infection prior to pregnancy induces the accumulation of CD4+ and CD8+ T cells in the uterus.
-
AExperimental approach.
-
BNumbers of CD4+ and CD8+ in 1 × 10⁶ uterine cells on gd 18.5 after preconceptual infection of the mother in comparison with non‐infected mothers (n = 7, n = 9, n: biological replicates). T cells were identified as CD45+CD3+ and either CD4+ or CD8+ cells.
-
CRepresentative dot plots of CD8+ T cells from peripheral blood divided in CD44+CD62L− effector/effector memory (EM), CD44+CD62L+ central memory (CM), and CD44−CD62L+ naïve subpopulations. Left: non‐infected pregnant control mouse, right: previously infected pregnant mouse.
-
D–GPercentage of EM T cells (CD44+, CD62L−) among CD8+ T cells; (D) peripheral blood (n = 6, n = 9), (E) uterus‐draining lymph nodes (n = 6, n = 9), (F) spleen (n = 7, n = 8), (G) uterus (n = 7 each); n: biological replicates.
-
HRepresentative dot plots of ovalbumin‐specific CD8+ EM T cells stained with H‐2Kb ovalbumin257‐264 tetramers (OVA tetramers) from peripheral blood. Left: non‐infected pregnant control mouse, right: previously infected pregnant mouse.
-
I–LPercentage of ovalbumin‐specific CD8+ EM T cells; (I) peripheral blood (n = 7, n = 9), (J) uterus‐draining lymph nodes (n = 7, n = 9), (K) spleen (n = 8 each), (L) uterus (n = 6, n = 9); n: biological replicates.
Data information: In (B), (D–G), (I–L), data are presented as mean ± SEM. *P ≤ 0.05; **P ≤ 0.01; ***P ≤ 0.001; ****P ≤ 0.0001 (E, J, K, L: Student's t‐test; B, D, F, G, I: Mann–Whitney‐U test).
Source data are available online for this figure.