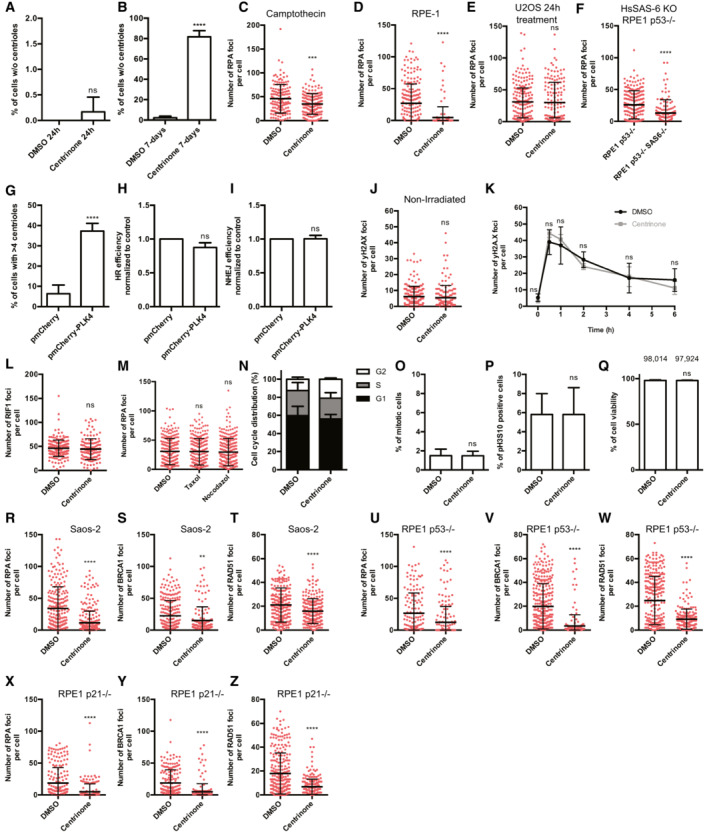
Figure EV1. Lack of centrioles affect DNA repair by homologous recombination.

-
A, BU2OS cells were treated with 125 nM of centrinone, or DMSO as a control, for 24 h (A) or 7 days (B). Then, the presence of centrosomes was immunodetected using an antibody against the centriolar proteins γ‐tubulin and CP110. The percentage of cells without centrioles was counted and plotted.
-
CU2OS cells treated for 7 days with centrinone or DMSO, as indicated, were exposed to Camptothecin 1 μM for 1 h and prepared for immunofluorescence using an anti‐RPA antibody as described in the Materials and Methods section. The number of RPA foci per cell for at least 200 cells per condition was quantified automatically using FIJI software and plotted. One representative experiment out of three performed with similar results is shown.
-
D–F(D) RPE‐1 cells treated for 7 days with centrinone or DMSO, as indicated, were irradiated with 10 Gy and 1 h later prepared for immunofluorescence using an anti‐RPA antibody as described in the Materials and Methods section. The number of RPA foci per cell was calculated as in (C). The number of RPA foci per cell for at least 200 cells per condition was quantified automatically using FIJI software and plotted. One representative biological replicate out of three that rendered similar results is shown. (E) As in (D), but in U2OS cells treated for 24 h with centrinone or DMSO. (F) As in D, but in p53 KO or p53 KO HsSAS‐6 KO RPE‐1 cells.
-
GU2OS cells transfected with a plasmid harboring a mCherry‐tagged PLK4, or an empty vector as a control, were grown for 3 days. Then, the number of centrosomes was immunodetected using an antibody against the centriolar proteins γ‐tubulin and CP110. The number of cells with more than four centrioles was counted and plotted.
-
HSame as Fig 1A, but in cells overexpressing or not PLK4.
-
ISame as Fig 1B, but in cells overexpressing or not PLK4.
-
JU2OS cells treated for 7 days with centrinone or DMSO, as indicated, were prepared for immunofluorescence using an anti‐γH2AX antibody as described in the Materials and Methods section. The number of γH2AX foci per cell for at least 200 cells per condition was quantified automatically using FIJI software and plotted. One representative experiment out of three performed with similar results is shown.
-
KDSB repair kinetic using γH2AX as a proxy. U2OS cells exposed to centrinone or DMSO as a control for 7 days were irradiated (2 Gy). Samples were collected at the indicated time points and γH2AX was immunodetected using a specific antibody as described in the Materials and Methods section. NI indicates a non‐irradiated sample taken just before irradiation. The number of γH2AX foci was scored and plotted.
-
LSame as Fig 1C, but using an antibody against the NHEJ factor RIF1. The number of RIF1 foci per cell for at least 200 cells per condition was quantified automatically using FIJI software and plotted. One representative biological replicate out of three that rendered similar results is shown.
-
MSame as Fig 1C, but in cells treated with Taxol, Nocodazole or DMSO. The number of RPA foci per cell for at least 200 cells per condition was quantified automatically using FIJI software and plotted. One representative biological replica out of three that rendered similar results is shown.
-
NCell cycle distribution of samples treated for 7 days with centrinone or DMSO, as indicated.
-
O, P(O) U2OS cells treated for 7 days with centrinone or DMSO, as indicated, were fixed and the percentage of mitotic cells was quantified based on DAPI staining. At least 400 cells were quantified per condition. (P) Same as (O) but cells were immunostained with an antibody against phospho‐H3S10. At least 400 cells were scored per condition and the percentage of phospho‐H3S10 positive cells was quantified.
-
QCell viability of U2OS cells treated for 7 days with centrinone or DMSO was quantified by Trypan Blue staining and plotted.
-
R–TSame as Fig 1C–E but using Saos‐2 cells.
-
U–WSame as Fig 1C–E but using RPE‐1 p53 KO cells.
-
X–ZSame as Fig 1C–E but using RPE‐1 p21 KO cells.
Data information: (A, B, G–I, K, O–Q) The average and standard deviation of three independent experiments is shown. The statistical significance was calculated using a Student's t‐test. (C–F, J, L, M, R–Z) One representative experiment out of three performed with similar results is shown. Error bars represent standard deviations. P‐values are represented with two (P < 0.01), three (P < 0.001) or four (P < 0.0001) asterisks. Non‐statistical significance is labeled ns. (R–Z) The number of RPA foci per cell for at least 200 cells per condition was quantified automatically using FIJI software and plotted. One representative biological replicate out of three that rendered similar results is shown.
