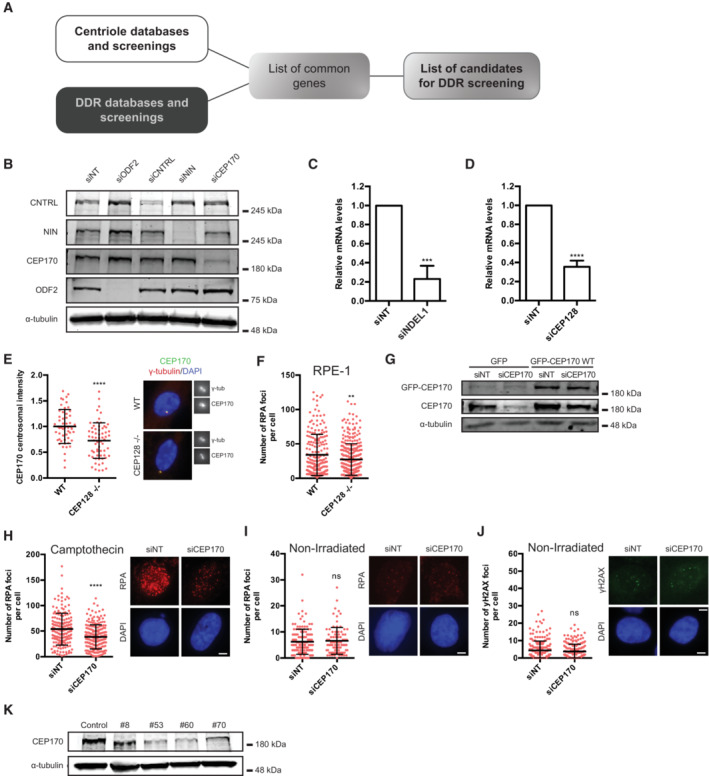
Figure EV2. Identification of the subdistal appendages as involved in HR regulation.

-
APipeline for identification of candidate genes involved in the connection between the centrosome and the DDR.
-
BU2OS cells were transfected with the indicated siRNAs and 48 h later, protein samples were prepared, resolved in SDS‐PAGE and blotted with the indicated antibodies.
-
C, D(C) U2OS cells were transfected with the indicated siRNAs. Forty‐eight hours later, total RNA was isolated and the levels of the NDEL1 RNA were calculated using Q‐PCR. The levels were normalized to the sample transfected with a control siRNA, taken as one. The average and standard deviation of three experiments is plotted. Statistical significance was calculated using a Student's t‐test. (D) Same as (C) but in cells transfected with a siRNA against CEP128 and using Q‐PCR primers against the mRNA for this protein.
-
ESame as Fig 2D but for RPE‐1 CEP128 KO or RPE‐1 control cells. The centriolar intensity of CEP170 was measured at least in 50 cells per condition and quantified using FIJI software and plotted. The average and standard deviation of one representative experiment out of three biological replicas that rendered similar results in shown.
-
FSame as Fig 1C but for RPE‐1 CEP128 KO or RPE‐1 control cells. The number of RPA foci per cell for at least 200 cells per condition was quantified automatically using FIJI software and plotted. One representative experiment out of three biological replicas that rendered similar results in shown.
-
GProtein samples were prepared from cells treated as in Fig 2F, resolved in SDS‐PAGE and blotted with anti‐GFP, anti‐CEP170 and anti‐alpha-Tubulin antibodies as indicated. Note that the faint band observed with the anti‐GFP antibody in the first two lanes is unspecific. Also note that CEP170 and GFP‐CEP170 bands could not be resolved with the anti‐CEP170 antibody due to the high size of these proteins.
-
HSame as Fig EV1C but in CEP170 siRNA‐depleted or siRNA control cells.
-
I, JSame as in Fig EV1J but for CEP170 siRNA‐depleted or siRNA control cells stained with anti‐RPA antibodies (I) or γH2AX antibodies (J).
-
KProtein samples were prepared from U2OS CEP170 heterozygous KO clones, resolved in SDS‐PAGE and blotted with the indicated antibodies.
Data information: (C and D) The average and standard deviation of three independent experiments is shown. The statistical significance was calculated using a Student's t‐test. P‐values are represented with two (P < 0.01), three (P < 0.001) or four (P < 0.0001) asterisks. Non‐statistical significance is labeled ns.
