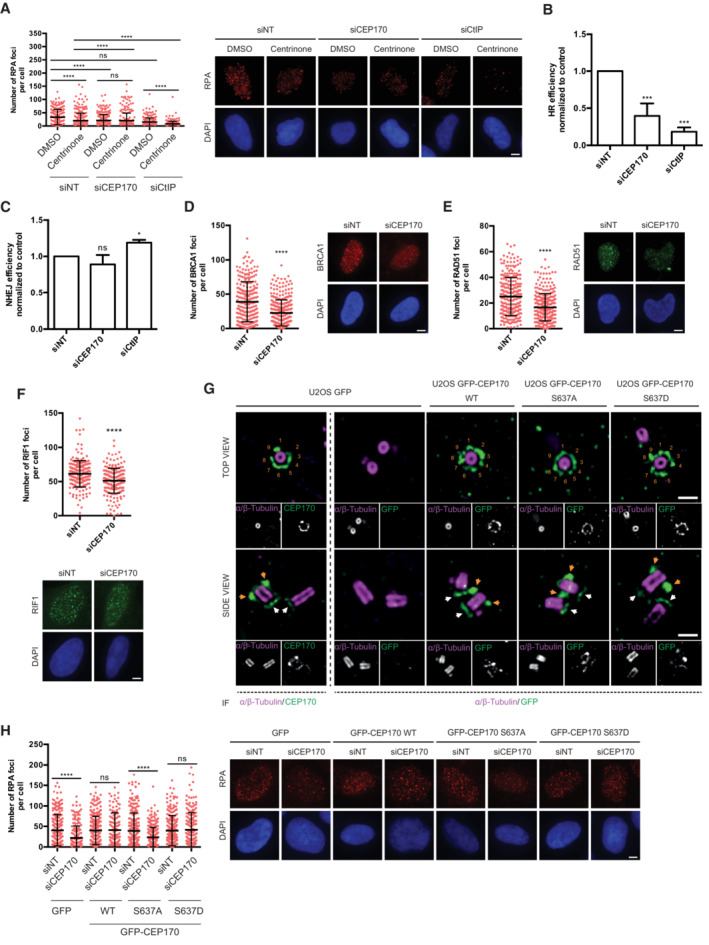
Figure 3. CEP170 phosphorylation at centrosomes is required for resection.

-
AU2OS cells were treated with centrinone or the vehicle DMSO and transfected with the indicated siRNAs. The number of RPA foci per cell for at least 200 cells per condition was quantified automatically using FIJI software and plotted. One representative experiment out of three performed with similar results is shown (left). Representative images are shown (right). Scale bar in white represents 7 μm. Statistical significance was calculated using a two‐way ANOVA.
-
B, C(B) HR was studied as indicated in Fig 1A in cells bearing the DR‐GFP reporter depleted for the indicated factors. (C) Same as (B), but using cells harboring the NHEJ reporter EJ5‐GFP.
-
D–F(D) The number of BRCA1 foci per cell for at least 200 cells transfected with a siRNA against CEP170 or a siRNA control was quantified automatically using FIJI software and plotted. One representative experiment out of three performed with similar results is shown (left). Representative image on the right side. (E) Same as (D) but using an antibody against RAD51 (left). Representative images on the right side. (F) Same as (D) but using an antibody against RIF1 (top). Representative images at the bottom.
-
GUltrastructure expansion microscopy (U‐ExM) images of U2OS expressing GFP, GFP‐CEP170 WT, GFP‐CEP170 S637A, or GFP‐CEP170 S637D. Images show one representative top view (top panels) and side view (bottom panels). Cells were co‐immunostained against alpha and beta tubulin and endogenous CEP170 or GFP as indicated. Orange numbers label the nine SDAs. Orange arrows point to subdistal appendage localization and white arrows to centriole proximal localization of CEP170 variants. Scale bar 500 nm.
-
HSame as (A) but in cells stably expressing the indicated CEP170 variant tagged with GFP or the control GFP plasmid and transfected with siCEP170 or a control sequence (left). Representative images on the right side. The number of RPA foci per cell for at least 200 cells per condition was quantified automatically using FIJI software and plotted. One representative experiment out of three biological replicates that rendered similar results is shown. Scale bar in white represents 7 µm.
Data information: In (B and C) the average and standard deviation of three independent experiments is shown. For (A, D–F, and H) error bars represent the standard deviation. (A–F and H) the statistical significance was calculated using a Student's t‐test. P‐values are represented with one (P < 0.05), three (P < 0.001), or four (P < 0.0001) asterisks. Non‐statistical significance is labeled ns.
Source data are available online for this figure.
