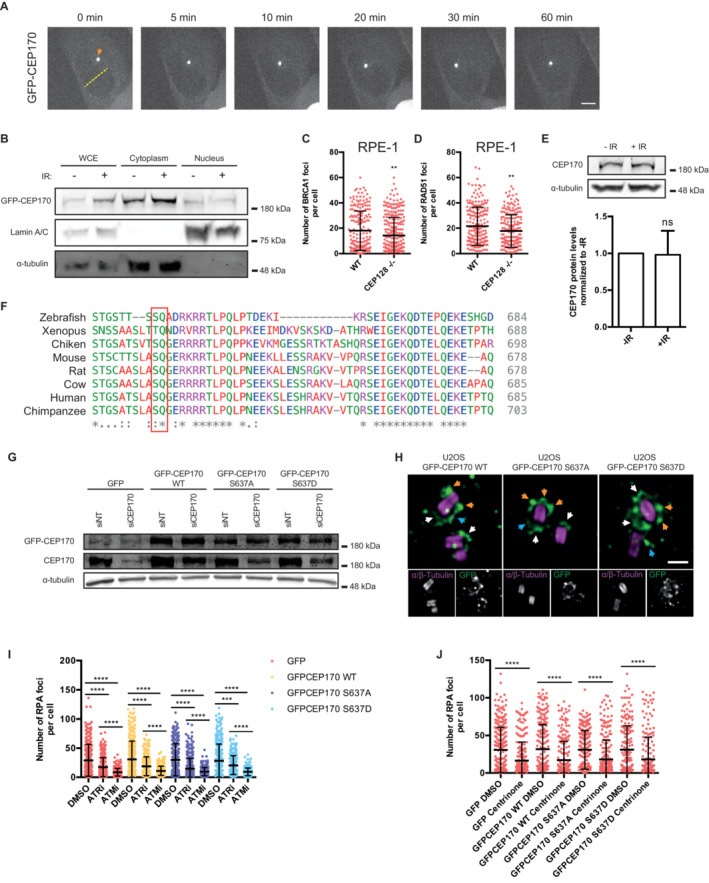
Figure EV3. CEP170 in response to DNA damage.

-
AA representative U2OS cell of a total of 20 inspected expressing GFP‐CEP170 and exposed to laser micro irradiation (yellow dashed line). Cells were monitored over 1 h taking images every 5 min. The orange arrow points to centrosomal CEP170 signal. Scale bar 7 μm.
-
BU2OS cells stably expressing a GFP‐CEP170 construct were irradiated (10 Gy, plus sign) or not (minus sign). Protein samples were prepared 1 h later by nuclear fractionation as described in the Materials and Methods section. Samples were resolved in SDS‐PAGE and blotted with the indicated antibodies. Size ladder marker is shown on the right side. A representative image of three independent experiments is shown.
-
C, DSame as Fig 1D and E but for RPE‐1 CEP128 KO or RPE‐1 control cells.
-
ETotal levels of endogenous CEP170 were immunodetected in protein samples from U2OS cells irradiated (10 Gy, +IR) or not (−IR) resolved in SDS‐PAGE using an antibody against this protein. Size ladder marker is shown on the right side. A representative image of four independent experiments is shown on the top, and the average and standard deviation of the quantification of the western blots at the bottom.
-
FAlignment of human CEP170 sequence flanking Serine‐637 (red box) with the homologous sequences from the indicated vertebrates.
-
GProtein samples were prepared from cells treated as in Fig 3H, resolved in SDS‐PAGE and blotted with anti‐GFP, anti‐CEP170 and anti‐Tubulin antibodies as indicated. Note that the faint band observed with the anti‐GFP antibody in the first two lanes is unspecific. Also note that CEP170 and GFP‐CEP170 bands could not be resolved with the anti‐CEP170 antibody due to the high size of these proteins.
-
HSame as in Fig 3G but examples of ectopic centrosomal localization of GFP tagged CEP170 WT and mutant versions. Orange arrows point to subdistal appendage localization, white arrows to centriole proximal localization and blue arrows point to ectopic centrosomal localization of CEP170 variants. Scale bar 500 nm.
-
ISame as Fig 3H, but in cells pretreated for 1 h with inhibitors against ATM (ATMi), ATR (ATRi) or DMSO as a control.
-
JSame as Fig 1C but in cells treated with centrinone or DMSO and stably expressing the indicated GFP constructs.
Data information: (C, D, E, I, and J), The number of the indicated foci per cell for at least 200 cells per condition was quantified automatically using FIJI software and plotted. One representative experiment out of three biological replicates that rendered similar results is shown. Error bars represent standard deviation. The statistical significance was calculated using a Student's t‐test. P‐values are represented with two (P < 0.01), three (P < 0.001) or four (P < 0.0001) asterisks. Non‐statistical significance is labeled ns.
