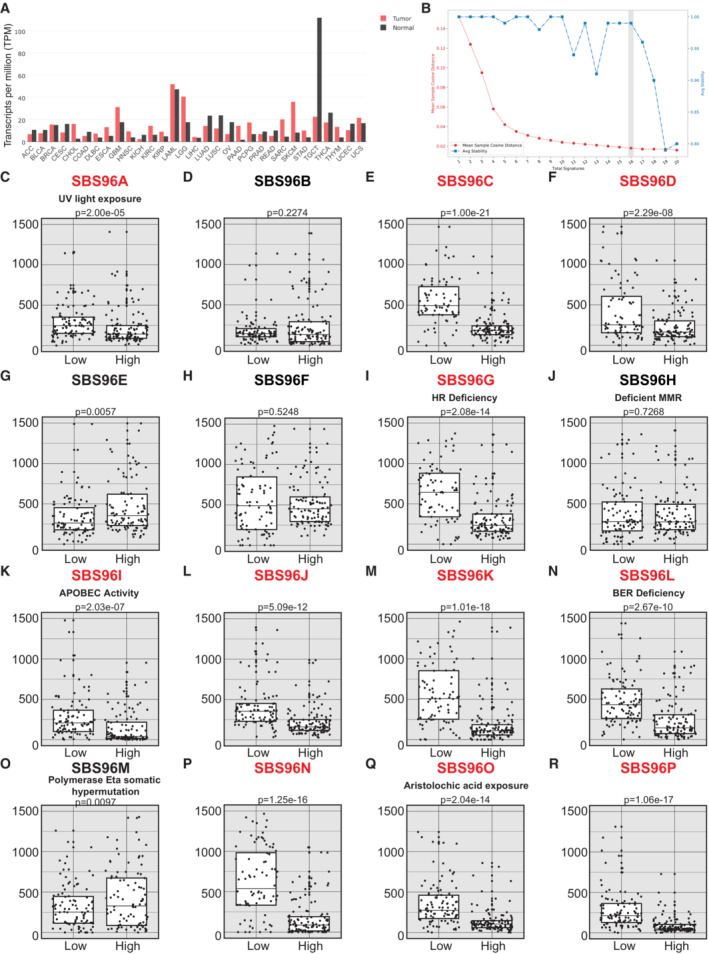
Figure 5. CEP170 levels modulate the mutational signature in cancer samples.

-
ACEP170 levels in tumor samples (red) and the equivalent healthy tissue (black), studied as indicated in the Materials and Methods section. Tumor acronyms are: ACC, adrenocortical carcinoma; BLCA, bladder urothelial carcinoma; BRCA, breast invasive carcinoma; CESC, cervical squamous cell carcinoma and endocervical adenocarcinoma; CHOL, cholangiocarcinoma; COAD, colon adenocarcinoma; DLBC, lymphoid neoplasm diffuse large B‐cell lymphoma; ESCA, esophageal carcinoma; GBM, glioblastoma multiforme; HNSC, head and neck squamous cell carcinoma; KICH, kidney chromophobe; KIRC, kidney renal clear cell carcinoma; KIRP, kidney renal papillary cell carcinoma; LAML, acute myeloid leukemia; LGG, brain lower grade glioma; LHIC, liver hepatocellular carcinoma; LUAD, lung adenocarcinoma; LUSC, lung squamous cell carcinoma; OV, ovarian serous cystadenocarcinoma; PAAD, pancreatic adenocarcinoma; PCPG, pheochromocytoma and paraganglioma; PRAD, prostate adenocarcinoma; READ, rectum adenocarcinoma; SARC, sarcoma; SKCM, skin cutaneous melanoma; STAD, stomach adenocarcinoma; TGCT, testicular germ cell tumors; THCA, thyroid carcinoma; THYM, thymoma; UCEC, uterine corpus endometrial carcinoma; UCS, uterine carcinosarcoma.
-
BCancer samples from PCAWG database containing mutation and CEP170 expression data were analyzed using SigProfiler to determine the number of significant signatures that could be analyzed in the dataset. The average stability and Mean Sample Cosine were plotted, and the number of optimal signatures was defined as 16. For other details, see the Materials and Methods section.
-
C–REach of the 16 optimal mutational signatures were analyzed in samples (i.e., independent tumors) at the lower quartile of CEP170 (low) or at the highest (high). The number of mutations in each sample associated to each signature was plotted. The central band represents the median, the lower and upper hinges correspond to the first and third quartiles and the upper and lower whiskers extends from the hinge to the largest value no further than 1.5 inter‐quartile range. Statistical significance was calculated using a Wilcoxon test, and the P‐value is shown on top of the graph. The assigned name of the signature is shown on top. The name of those signatures that show statistically significant changes between samples with high and low expression of CEP170 is written in red. For those signatures associated with a known etiology according to the COSMIC database, this is depicted between the name and the P‐value.
Source data are available online for this figure.
