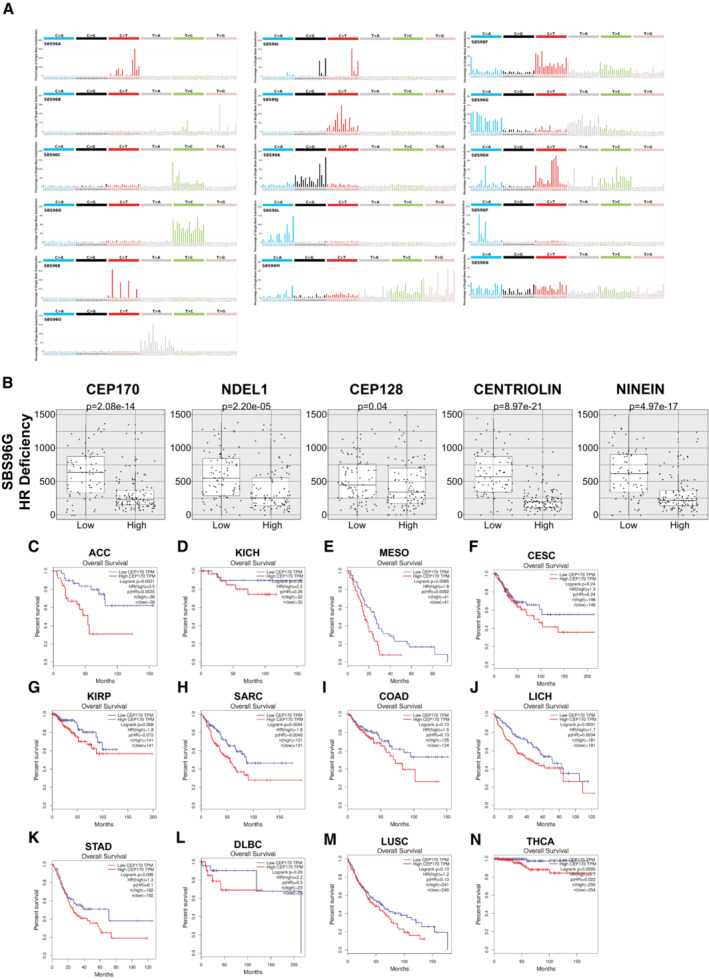
C–NSurvival data in different cancer types with different CEP170 expressions were collected from the web‐based tool GEPIA. Samples were split in two categories, the ones with an expression above the median (high; red lines) or below the median (low; blue lines). The number of individuals for each category is indicated in the top right corner of each chart. Overall survival of each category in each cancer type were plotted in Kaplan‐Meyer graphs. Statistical significance was calculated using a Log‐rank (Mantel–Cox) test and the P‐values are included. Tumor types: (C) ACC, adrenocortical carcinoma. (D) KICH, kidney chromophobe. (E) MESO, mesothelioma. (F) CESC, cervical squamous cell carcinoma and endocervical adenocarcinoma. (G) KIRP, kidney renal papillary cell carcinoma. (H) SARC, sarcoma. (I) COAD, colon adenocarcinoma. (J) LICH, liver hepatocellular carcinoma. (K) STAD, stomach adenocarcinoma. (L) DLBC, lymphoid neoplasm diffuse large B‐cell lymphoma. (M) LUSC, lung squamous cell carcinoma. (N) THCA, thyroid carcinoma.

