Figure 3.
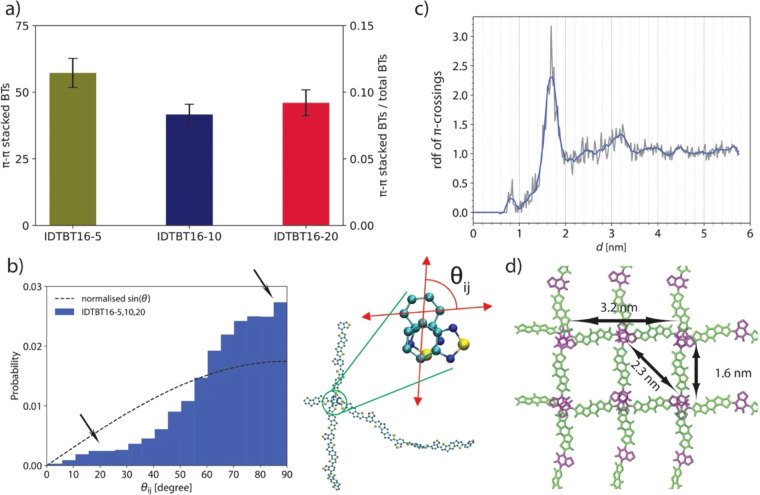
(a) Number of BT-BT π–π interactions for three polymer models. (b) The distribution of relative angle between local director vectors θij of chains around BT π-crossing junctions through 100 ns of IDTBT16-5, IDTBT16-10, and IDTBT16-20 simulations. (c) rdf of center of mass of BT-BT π-crossings for 100 ns of IDTBT16-5, IDTBT16-10, and IDTBT16-20. (d) Idealized model based on results shown in b and c to illustrate the distances where peaks in the rdf are found and the preferentially perpendicular arrangement of the backbone. Note that the cartoon is excessively idealized and the 3D arrangement of the chains only shows a slight preference to (rather than having an exact) squared lattice structure.

