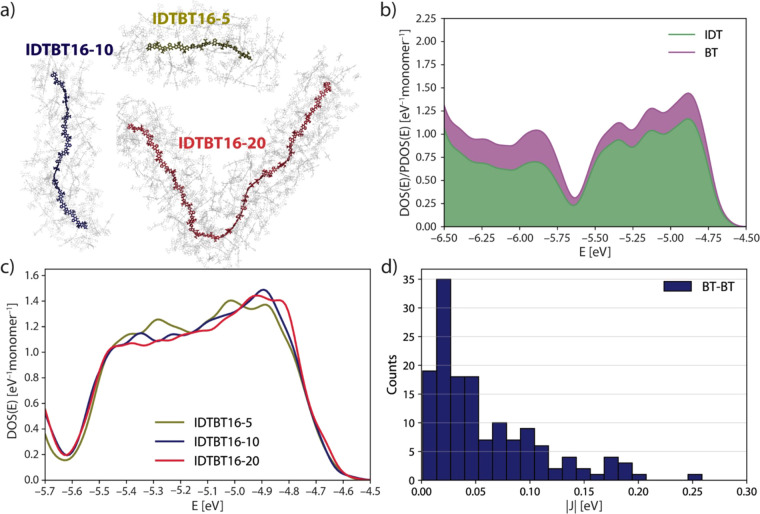
Figure 5.
(a) Visualization of central chains and electrostatic cutoffs for electronic structure calculations. (b) PDOS plotted for IDTBT16-10. (c) DOS across a small energy interval of the valence band for IDTBT16-5, IDTBT16-10, and IDTBT16-20. (d) Distribution of HOMO–HOMO transfer integrals calculated for 147 BT-BT crossing points.

