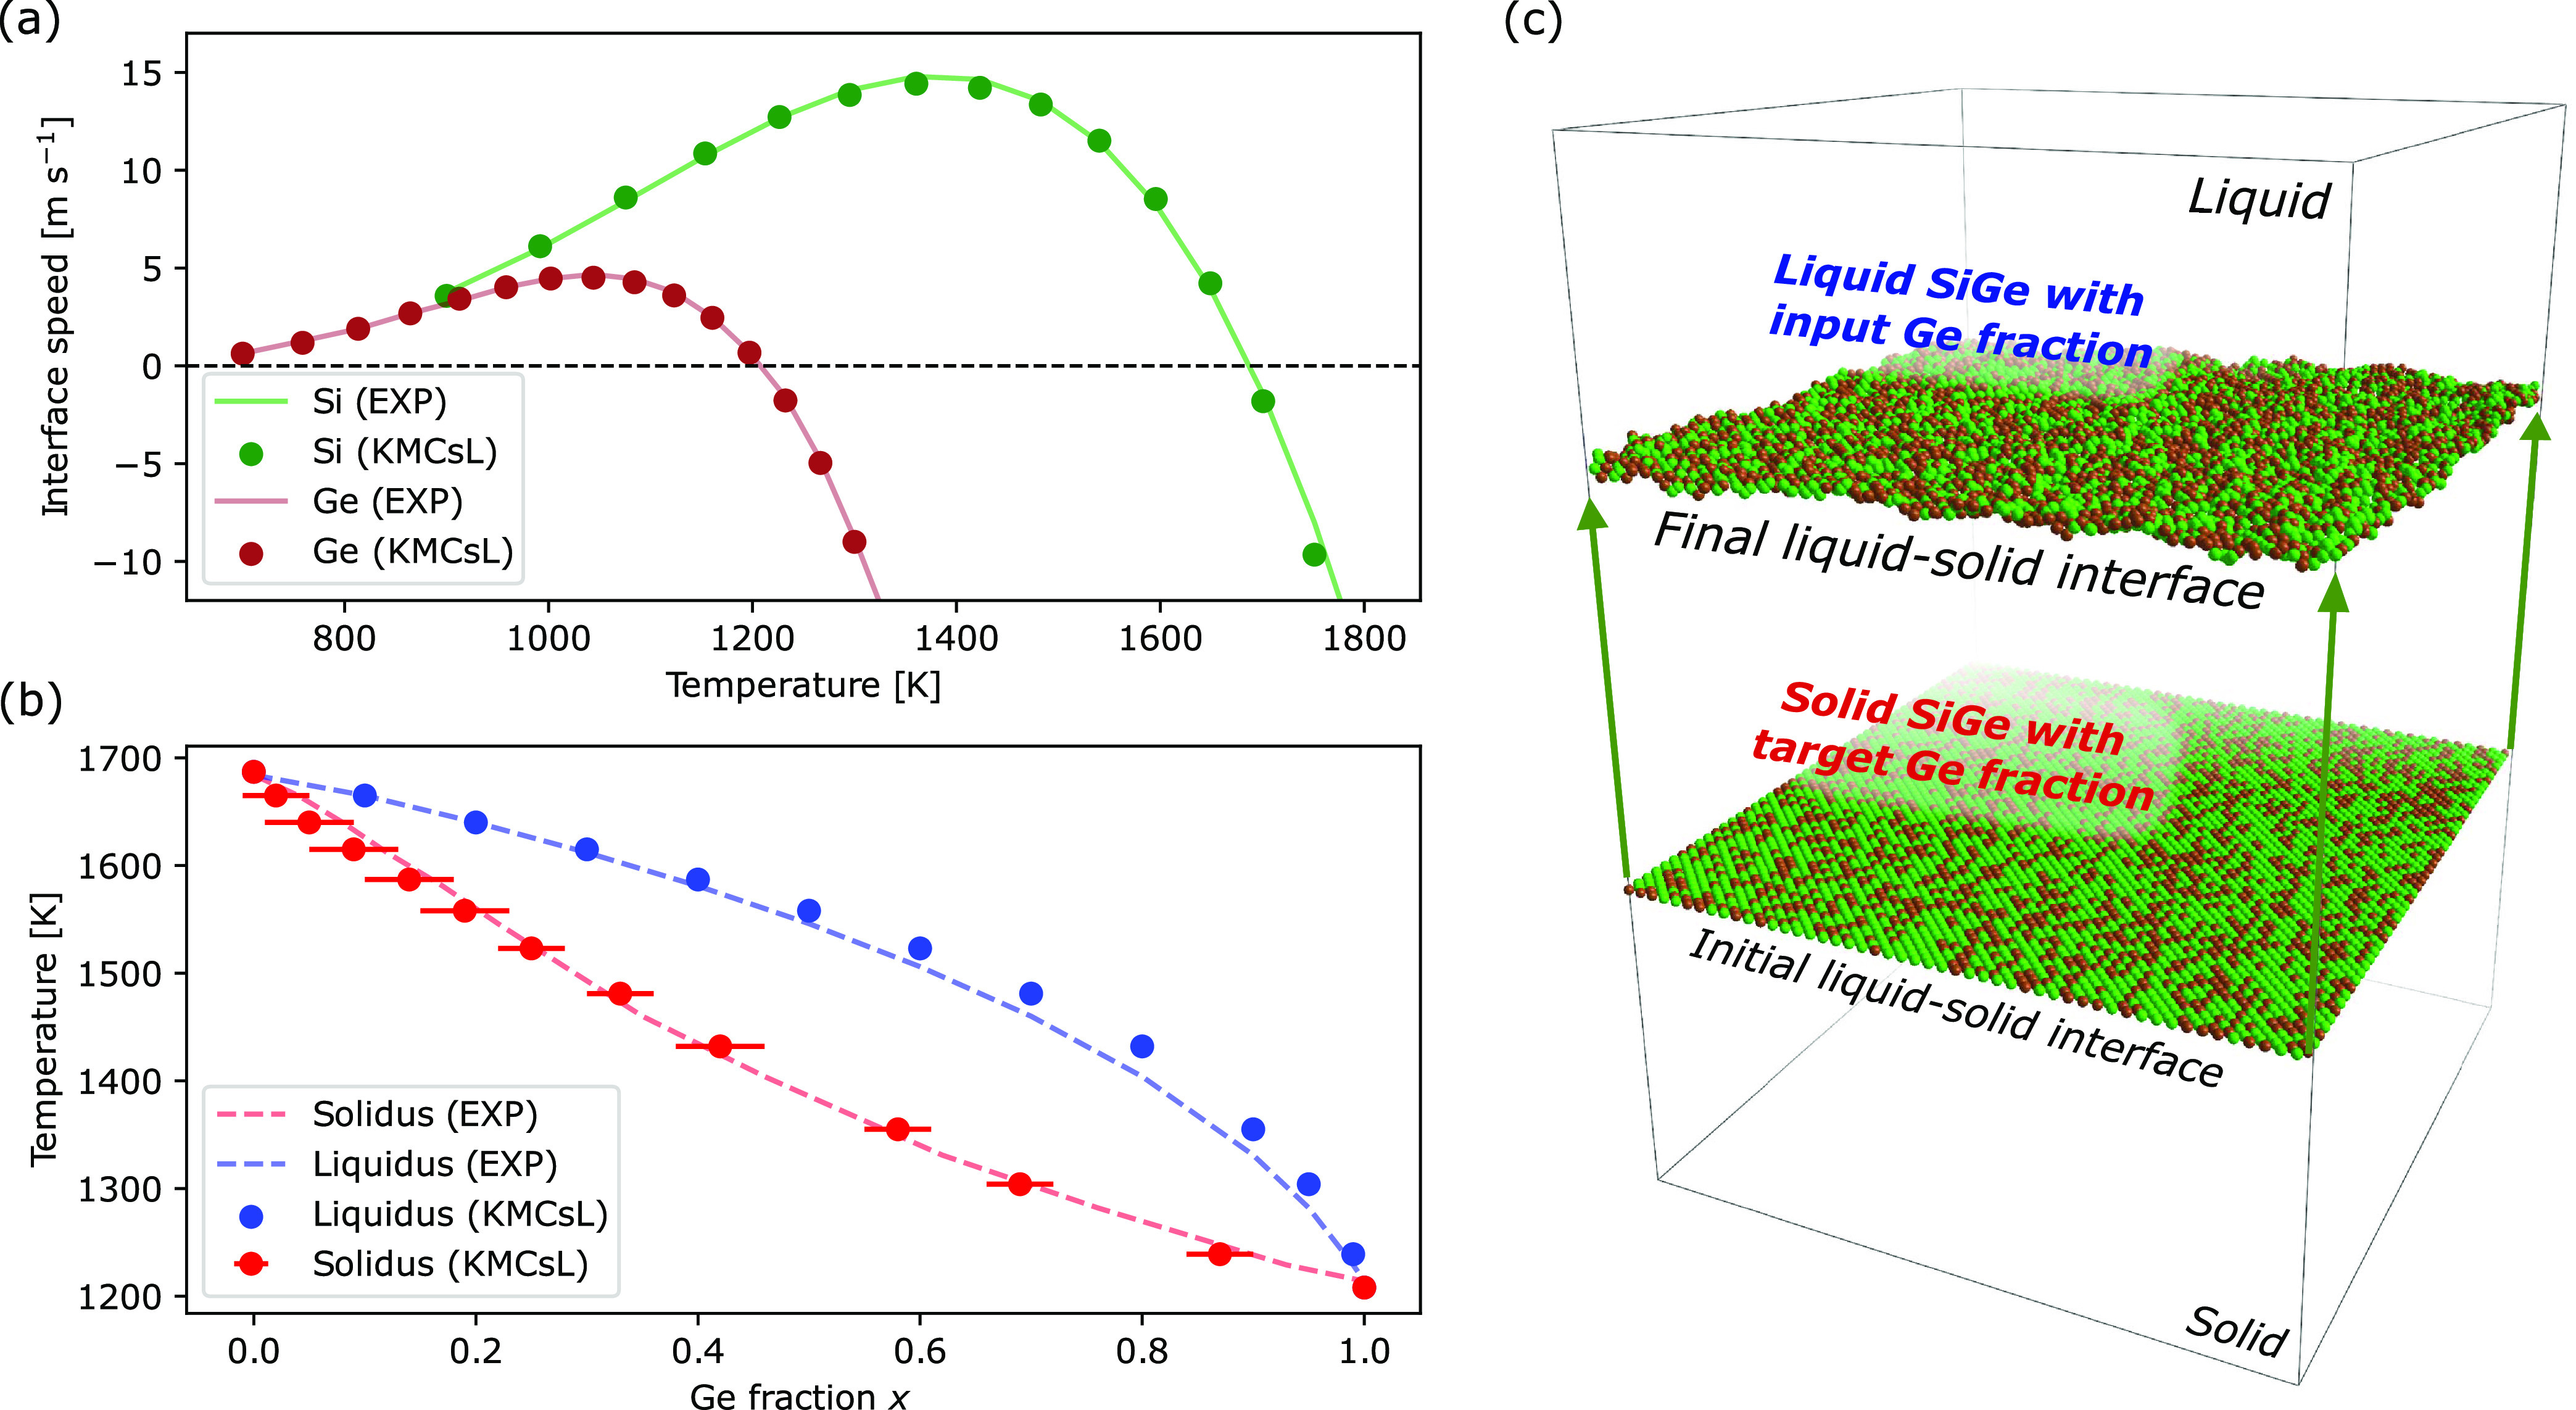
Figure 2.

KMCsL calibration for SiGe solid–liquid-phase transitions. (a) Calibrated results for the solid–liquid interface velocity in pure Si and pure Ge as a function of temperature (markers) in comparison with the respective Fulcher–Vogel profile (lines). (b) Calibrated results for the SiGe phase diagram (markers), along with the expected phase diagram (dashed lines). The horizontal bars reflect spatial compositional variations in the solidified layer. (c) Schematics of the strategy followed for phase diagram calibration. The superimposed snapshots show initial and final states of a calibrated simulation for T ≈ 1410 and xL ≈ 0.8, resulting in xS ≈ 0.43. Solid undercoordinated Si and Ge atoms (green and brown, respectively) identify the interface.
