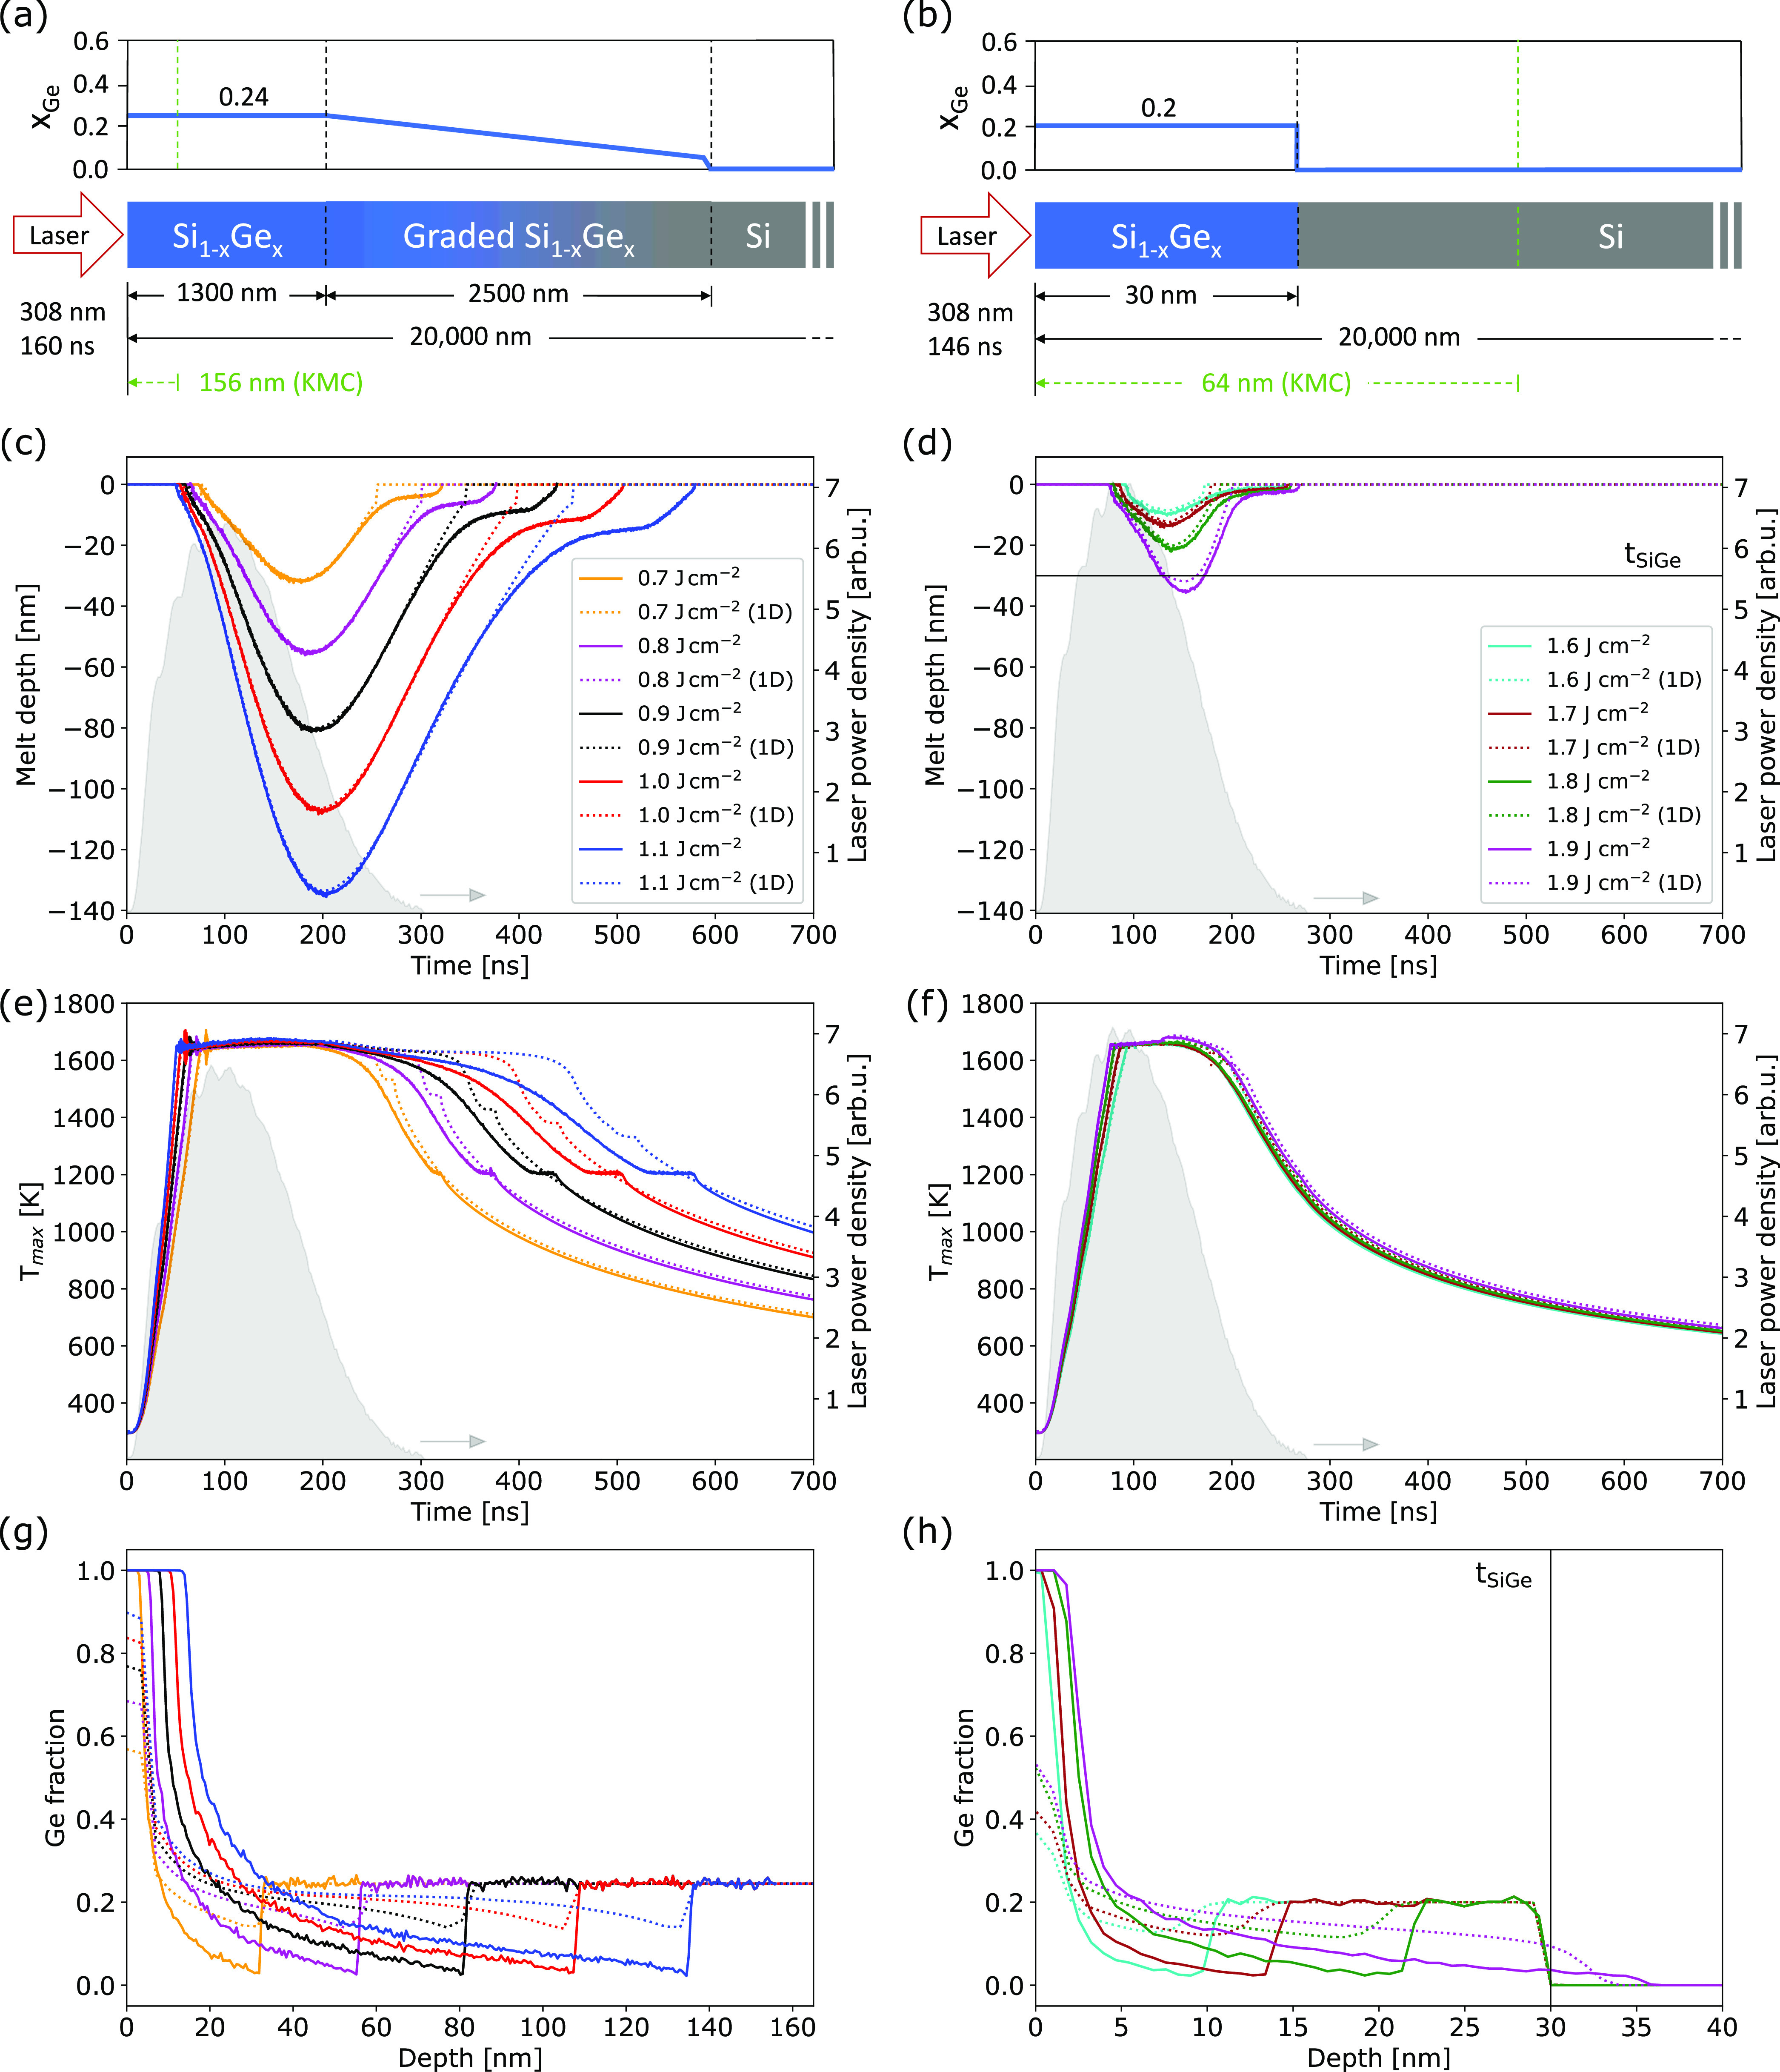
Figure 3.

Comparison between atomistic FEM-KMCsL (solid lines) and nonatomistic phase-field simulations (dotted lines). (a, b) Pulsed-LA simulation setup for relaxed (left) and strained SiGe (right) with thickness tSiGe = 30 nm, including system sizes and initial composition. (c, d) Time variation of melt depth, (e, f) maximum temperature in mesh, and (g, h) postanneal Ge profiles obtained for various laser energy densities. The laser pulse shape (filled gray areas) and power density (right axes) are also reported.
