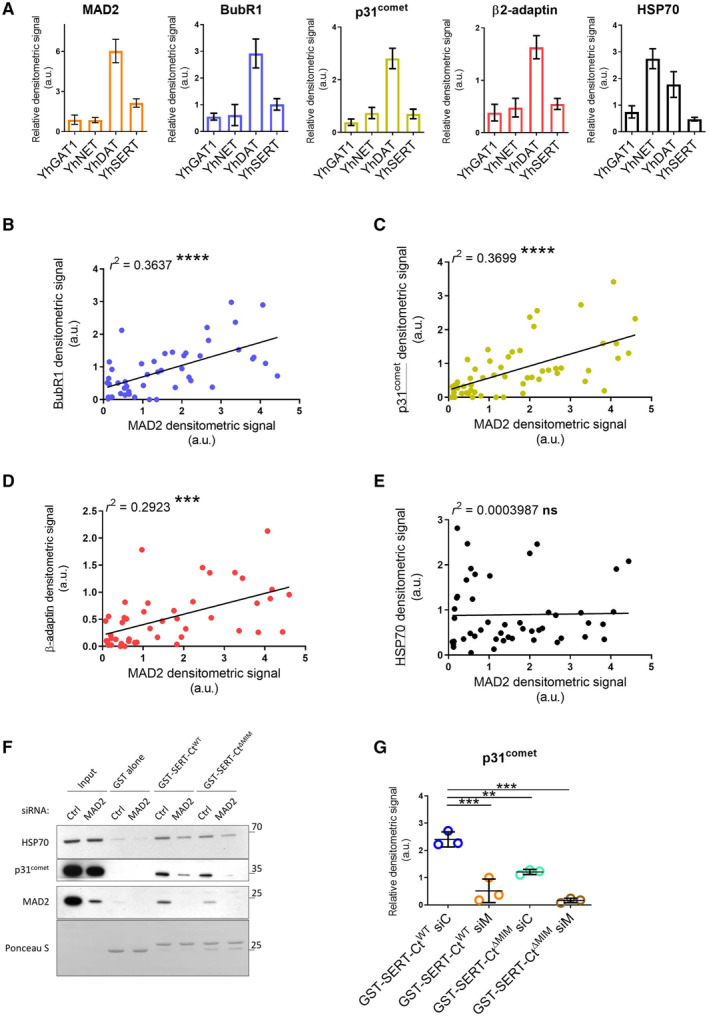
Figure EV2. Association of full‐length transporters with BubR1, β2‐adaptin, and p31comet correlates with MAD2 association.

-
ADensitometric signals in Fig 3C/co‐IP:YFP were quantified using ImageJ and normalized to their respective transporter signal intensities; error bars represent SEM. Data derive from seven (MAD2), six (BubR1), seven (p31comet), six (β2‐adaptin), and six (HSP70) independent biological replicates.
-
B–EScatter plots for the co‐IP of indicated proteins (y‐axis) against the co‐IP of MAD2 (x‐axis) (cf. Fig 3C); r 2 indicates the squared linear correlation coefficient; ***P < 0.001, ****P < 0.0001, ns—not significant. Data derive from six (BubR1), seven (p31comet), six (β2‐adaptin), and six (HSP70) independent biological replicates.
-
F, GHEK‐293 cells were transfected with the indicated siRNAs and cell lysates were used for GST pull‐down experiments using the indicated GST proteins. One‐way ANOVA with Dunnett's multiple post hoc comparison; **P < 0.01, ***P < 0.001; error bars represent SD of three independent biological replicates.
