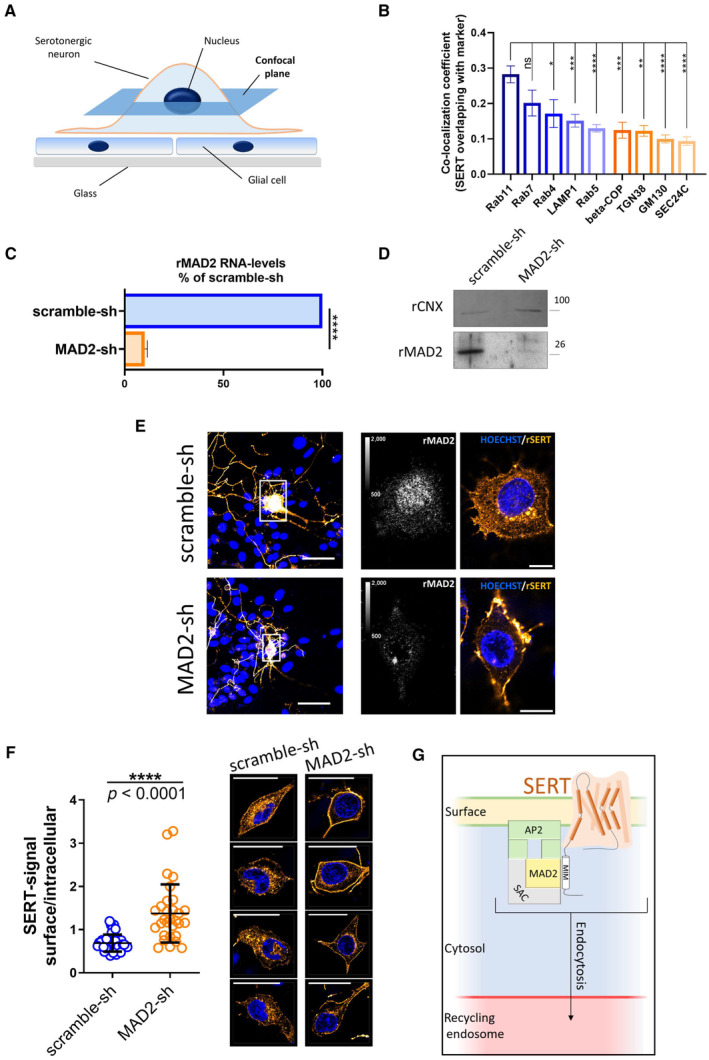
Figure 5. MAD2 depletion in dorsal raphe neurons prevents SERT endocytosis.

-
ASchematic representation of the confocal plane (dark blue) selected for visualizing immunoreactivity in somata of serotonergic neurons in Panel (E).
-
BImmunofluorescence images of rat primary dorsal raphe neurons in Figs EV4 and EV5 were analyzed using ImageJ/JACoP software. Bars indicate Manders' overlap coefficients for the fraction of SERT overlapping with the denoted marker protein. One‐way ANOVA and Tukey's multiple‐comparisons test; *P < 0.05, **P < 0.01, ***P < 0.001, ****P < 0.0001. Number of analyzed cells: Rab11A n = 20; Rab7A n = 11; Rab4 n = 8; LAMP1 n = 12; Rab5 n = 14; beta‐COP n = 7; TGN38 n = 5; GM130 n = 11; SEC24C n = 11. Error bars represent SEM.
-
C, DPrimary rat cortical glia cells were cultured as described under “Materials and Methods.” After 14 days, cells were infected with lentiviral particles encoding either scramble shRNA or shRNA directed against MAD2. Five days after infection, cells were subjected to quantitative PCR (n = 3 biological replicates) or immunoblotting (n = 2 biological replicates). For the latter, the ER resident protein calnexin was used as loading control. For Panel (C), ****P < 0.0001 in an unpaired two‐tailed t‐test. Error bars represent SD.
-
EPrimary rat dorsal raphe neurons were cultured as described under “Materials and Methods.” After 14 days, cells were infected with lentiviral particles encoding either scramble shRNA or shRNA directed against MAD2. Five days after infection, cells were fixed in acetone/methanol (1:1) and subjected to immunofluorescence with the indicated primary and secondary antibodies. Confocal images were captured on a Nikon A1 laser scanning confocal microscope at either 20× (Fig 5E, left panel) or 60× (Fig 5E, right panel) magnification; representative images are shown. Due to imaging conditions, the optical section thickness is increased at 20× compared to 60× magnification. Calibration bars in images showing rMAD2 represent arbitrary fluorescence units. Scale bars represent 50 and 10 μm for 20× and 60× magnification, respectively.
-
FSurface and intracellular SERT signal from scramble‐ and MAD2‐shRNA‐infected neurons (n = 40 and n = 30, respectively) was quantified within regions of interest (ROIs) using ImageJ software, and the resulting ratios were compared using an unpaired two‐tailed t‐test, the P‐value was below 0.0001 (n = 4 biological replicates). Error bars represent SD. The right part provides four additional representative images of both scramble‐shRNA and MAD2‐shRNA expressing serotonergic neurons (SERT: orange, nuclei: blue). Scale bars represent 30 μm.
-
GModel of SERT endocytosis in somata of serotonergic neurons: MAD2 (in its closed conformation) binds a MAD2 interaction motif (MIM) in the SERT C‐terminus and forms a complex with other spindle assembly checkpoint proteins (SAC) and adaptor protein 2 (AP2). Subsequent endocytosis delivers SERT to the recycling endosome.
Source data are available online for this figure.
