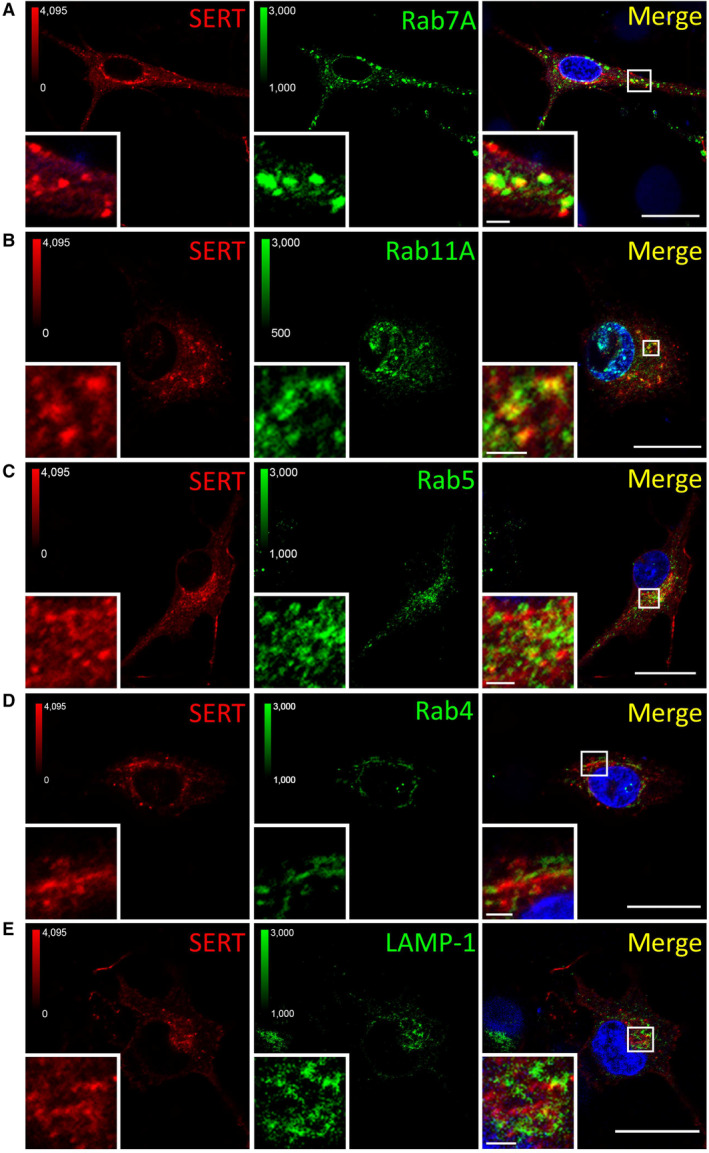
Figure EV5. Co‐localization between SERT and endocytic markers.

-
A–EPrimary rat dorsal raphe neurons were cultured and imaged as in Fig EV4, using the indicated primary antibodies. Scale bars represent 20 and 2 μm in full‐size images and zoomed areas, respectively.
