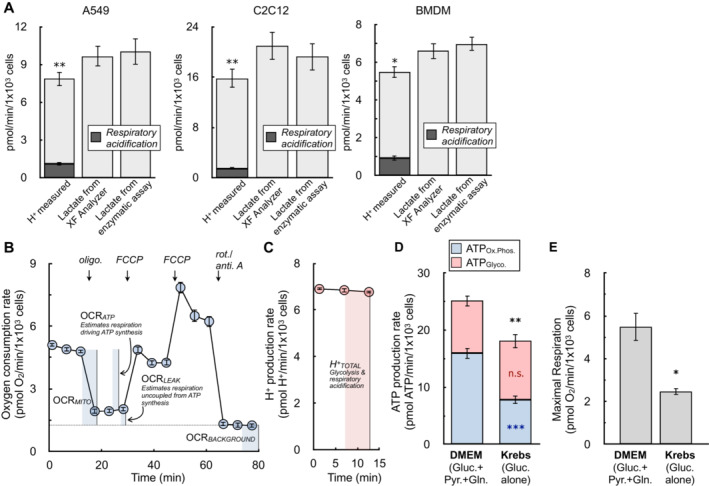
Figure 3. Transformation of ECAR into lactate efflux allows calculation of ATP production rates.

- The H+ production rate from the XF Analyzer (left bar in each graph), the calculated lactate efflux rate from the XF Analyzer (center bar), and the lactate efflux rate measured from an enzymatic assay (right bar) are given for A549 cells, C2C12 cells, and primary bone marrow‐derived macrophages (BMDMs). Cells are offered 8 mM glucose, 2 mM pyruvate, and 2 mM glutamine in experimental medium supplemented with 5 mM HEPES. The shaded component of the H+ production rates for each cell type is the calculated contribution from respiratory acidification (n ≥ 4 biological replicates).
- The oxygen consumption rate from a representative experiment with A549 cells is presented. Assay medium is as in (A). The parameters needed to calculate the ATP production rate are indicated within the figure (n = 6 technical replicates).
- The H+ production rate from the kinetic trace in (B) is presented. Only the initial rates are shown, as these are the only measurements required to calculate the ATP production rate (n = 6 technical replicates).
- ATP production rates calculated for A549 cells in DMEM supplemented with 8 mM glucose, 2 mM glutamine, and 2 mM pyruvate and Krebs–Henseleit buffer supplemented with only 10 mM glucose (n = 4 biological replicates).
- Maximal respiratory rates measured in response to oligomycin and FCCP for treatments as in (D) (n = 4 biological replicates).
All data are mean ± S.E.M. Statistical analysis for 3A was analyzed by a one‐way, repeated measures ANOVA followed by Dunnett's post hoc multiple comparisons tests. Individual pairwise comparisons for 3D and 3E were analyzed by a two‐tailed Student's t‐test. *P < 0.05; **P < 0.01; ***P < 0.001.
Source data are available online for this figure.
