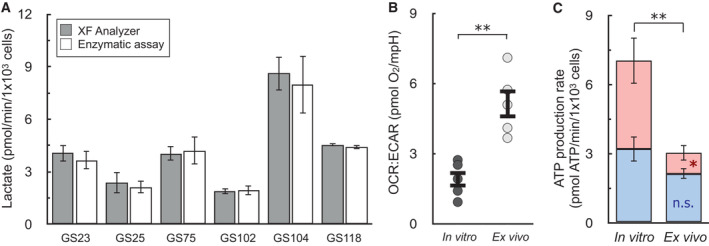
Figure 4. ATP production rates capture changes OCR:ECAR ratios cannot in primary cancer cell models.

- Lactate as measured by the XF Analyzer matches enzymatic lactate measurements for a panel of patient‐derived, gliomasphere (GS) cell lines after in vitro culture (n ≥ 3 biological replicates for each line).
- OCR:ECAR ratios for patient‐derived glioblastoma cells cultured in vitro or assayed immediately after harvesting from mouse xenographs (ex vivo). Cell lined used were GS25, GBM39, GS114, GS116, GS122 (n = 5 biological replicates).
- ATP Production rates from cell types as in (B) (n = 5 biological replicates).
All data are mean ± S.E.M. Statistics were analyzed by a two‐tailed Student's t‐test. *P < 0.05; **P < 0.01.
Source data are available online for this figure.
