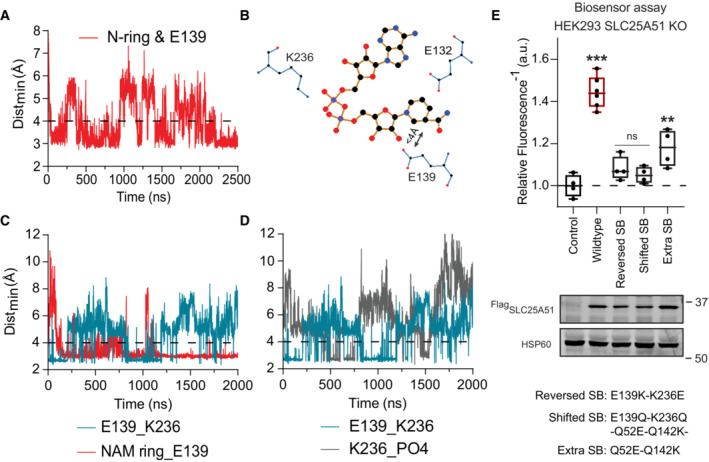
Figure 4. Substrate induced disruption of the matrix gate.

-
AMinimum distance between the nicotinamide ring and E139 over time, simulation 17 (Table EV1). Interaction cutoff at 4 Å is shown as a dashed line.
-
BTwo‐dimensional projection (Ligplot+) of NAD+ and its interaction with E132 and the E139‐K236 salt bridge.
-
CTime evolutions of the E139‐K236 salt bridge (teal) compared to the nicotinamide ring and E139 interaction (red); simulation 19 (Table EV1). Interaction cutoff at 4 Å is shown as a dashed line.
-
DTime evolutions of the E139‐K236 salt bridge (teal) compared to the phosphates in NAD+ and K236 (gray); simulation 19 (Table EV1). Interaction cutoff at 4 Å is shown as a dashed line.
-
EFree mitochondrial NAD+ levels measured using a ratiometric biosensor in HEK293 SLC25A51 KO cells expressing empty vector control, wildtype FlagSLC25A51, and indicated mutants. Measurements were taken at 48 h post‐transfection; the dashed line indicates the baseline defined by the empty vector control, and red denotes data equivalent to wildtype. Data are shown in box and whisker format, with hinges at 25th and 75th percentiles, whiskers represent min and max and the line is the median, n = 4–6 biological replicates, ANOVA P < 0.0001, post‐hoc Dunnett's test compared to empty vector control **P < 0.01, ***P < 0.001. (bottom) Protein expression from HEK293 SLC25A51 KO cells transiently transfected with empty vector control, wildtype FlagSLC25A51 and the indicated variants detected with anti‐Flag Western blot; HSP60, loading control.
Source data are available online for this figure.
