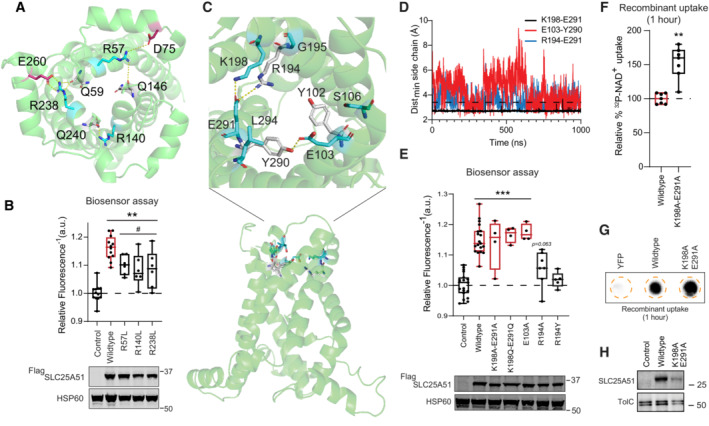
Figure EV4. The role of cap residues and cytoplasmic gate for SLC25A51 function.

-
ARelative positions of cap residues and their interactions (dashed lines) in a cartoon representation of SLC25A51.
-
BFree mitochondrial NAD+ levels measured using a ratiometric biosensor in HeLa cells expressing empty vector control (n = 12 biological replicates), wildtype FlagSLC25A51 (n = 12 biological replicates), and indicated mutants (n = 6 biological replicates). Measurements were taken at 24 h post‐transfection; the dashed line indicates the baseline defined by the empty vector control, and red denotes data equivalent to wildtype. Data are shown in box and whisker format, with hinges at 25th and 75th percentiles, whiskers represent min and max and the line is the median, ANOVA P < 0.0001, post‐hoc Dunnett's test compared to empty vector control (**) and compared to wildtype FlagSLC25A51 (#), **P < 0.01 and # P < 0.05. (bottom) Protein expression from HeLa cells transiently transfected with empty vector control, wildtype FlagSLC25A51 and the indicated variants using anti‐Flag Western blot; HSP60, loading control.
-
CRelative position of the cytoplasmic gate in a cartoon representation of SLC25A51.
-
DTime evolution of distance between indicated side chains for putative gate interactions. Interaction cutoff at 3.5 Å is shown as a dashed horizontal line.
-
EFree mitochondrial NAD+ levels measured using a ratiometric biosensor in HeLa cells expressing empty vector control (n = 19 biological replicates), wildtype FlagSLC25A51 (n = 19 biological replicates), and indicated mutants (n = 4–7 biological replicates). Measurements taken at 24 h post‐transfection; empty vector control baseline is shown as dashed line and wildtype activity and equivalent is in red color. Data are shown in box and whisker format, with hinges at 25th and 75th percentiles, whiskers represent min and max and the line is the median, ANOVA P < 0.0001, post‐hoc Dunnett's test compared to empty vector control, ***P < 0.001. (bottom) Protein expression from HeLa cells transiently transfected with empty vector control, wildtype FlagSLC25A51 and the indicated variants using anti‐Flag Western blot; HSP60, loading control.
-
FQuantitation of uptake of 32P‐NAD+ after 1 h by E. coli cells expressing wildtype SLC25A51 (amino acids 29–297) and the indicated mutant; wildtype activity and equivalent is in red color and the wildtype baseline is shown as dashed line. Data are shown in box and whisker format, with hinges at 25th and 75th percentiles, whiskers represent min and max and the line is the median, n = 7 biological replicates, unpaired t‐test ***P < 0.001.
-
GRepresentative phosphorimage of retained 32P‐NAD+ after 1 h by E. coli cells expressing wildtype SLC25A51 (amino acids 29–297), indicated variant, or YFP control.
-
HMembrane expression of wildtype SLC25A51 (amino acids 29–297), its indicated variant or YFP control in E. coli cells using anti‐SLC25A51 Western blot; TolC, loading control.
Source data are available online for this figure.
