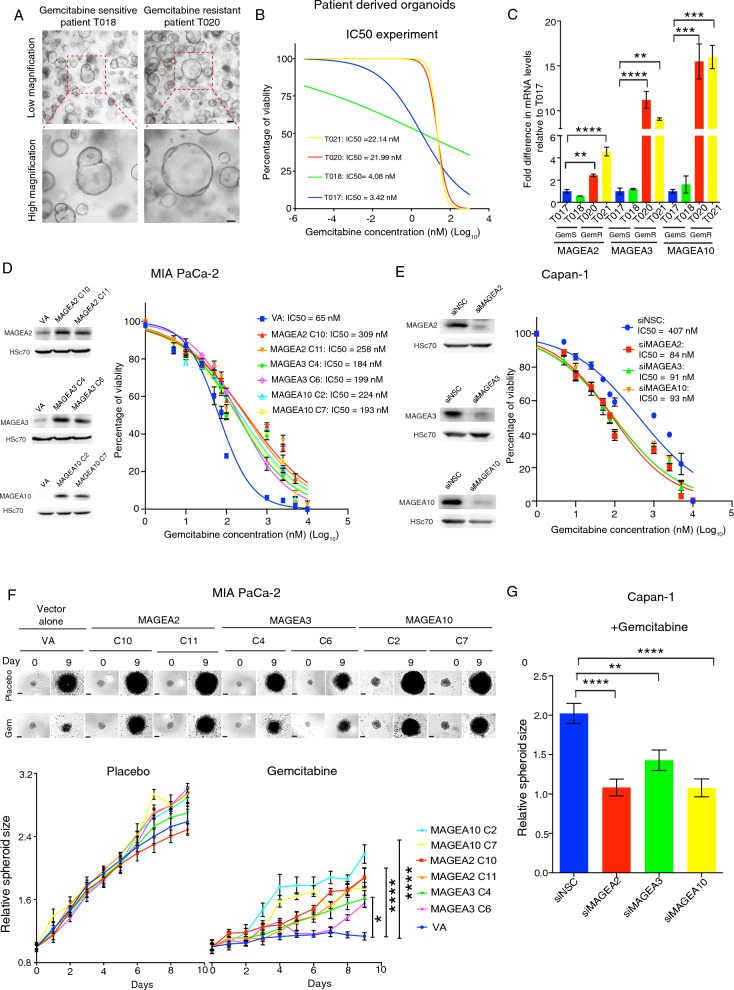
Fig. 2.
MAGEA overexpression is functionally linked to gemcitabine resistance. A Representative bright field images of GemS and GemR patient derived tumor organoids. B Gem IC50 dose examination of the tumor organoids from GemS (Patient T017 and T018) and GemR PDAC patients (Patient T020 and T021) respectively. C Analysis of MAGEA mRNA expression in GemS and GemR PDAC patient derived organoids (n = 3 experimental repeats). D Western blot analysis of MIA PaCa-2-stable clones expressing MAGEA2 (C10 and C11), MAGEA3 (C4 and C6) or MAGEA10 (C2 and C7) plus an empty vector transfected (VA) clone. Line graph shows the Gem IC50 experiment of MAGEA2/MAGEA3/MAGEA10- or VA-expressing cells (n = 9 experimental repeats). E Western blot analysis of Capan-1 cells transiently transfected with non-silencing control (siNSC) or MAGEA2, MAGEA3 or MAGEA10 targeting siRNA. Line graph shows the Gem IC50 experiment of Capan-1 cells transfected with siNSC or MAGEA2/MAGEA3/MAGEA10 targeting siRNA (n = 6 experimental repeats). F Spheroid assay of stable MAGEA2/MAGEA3/MAGEA10-expressing MIA PaCa-2 cells in the presence/absence of Gem treatment (n = 4–6 experimental repeats). G Bar chart represents the relative spheroid size of siMAGEA2/MAGEA3/MAGEA10 transfected Capan-1 cells after treated with Gem for 9 days. Means ± S.E.M. (n = 9 experimental repeats). *p < 0.05; **p < 0.01; ***p < 0.001; ****p < 0.0001. C, G One-way ANOVA. F Two-way ANOVA. Scale bars in (A) 200 μm (upper panel), 100 μm (lower panel), (F) represent 200 μm

