Figure 1.
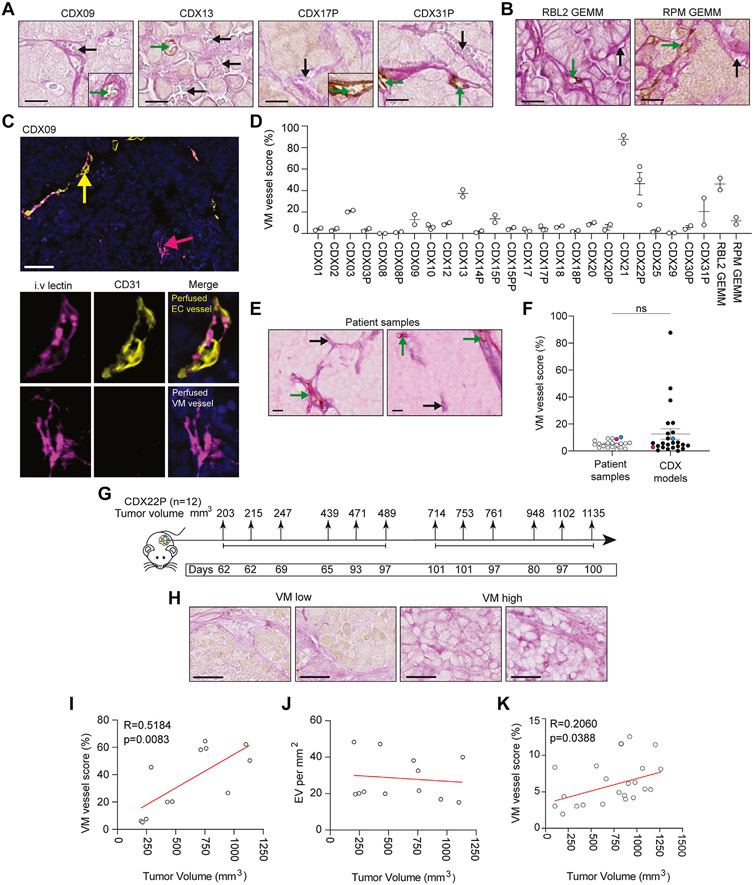
VM in SCLC CDX and GEMM. (A) IHC of VM vessels (PAS+/CD31−, pink, black arrows) and endothelial vessels (PAS+/CD31+, brown, green arrows) in CDX. Scale bars, 200 μm. CDX models were generated from patient CTCs at pre-chemotherapy baseline or at post-treatment disease progression time points (designated P). (B) IHC of VM vessels (PAS+/CD31−, pink, black arrows) and endothelial vessels (PAS+/CD31+, brown, green arrows) in RBL2 (Trp53fl/fl/Rb1fl/fl/Rbl2fl/fl)22 and RPM (Trp53fl/fl/Rb1fl/fl/MycLSL/LSL)23 GEMMs. Scale bars 200 μm. (C) Representative IF image of a perfused endothelial (EC) vessel (CD31+/intravenous tomato lectin+, yellow arrow) and a perfused VM vessel (CD31−/intravenous tomato lectin+, pink arrow) within a CDX09 tumor that was harvested after intravenous tomato lectin injection. Single-channel IF for CD31 (yellow) and intravenous tomato lectin (pink) illustrated with merged multiplex on the right in which nuclei are blue (DAPI stain). Scale bars 50 μm (left panel). (D) VM vessel score (% VM vessels relative to total vessels [VM + endothelial]) in CDX and GEMM (n = 2-3 independent tumor replicates). (E) IHC of VM vessels (PAS+/CD31−, pink, black arrows) and endothelial vessels (PAS+/CD31+, brown, green arrows) in SCLC patient biopsy samples. Scale bars 10 μm. (F) VM vessel score (% VM vessels relative to total vessels [VM + endothelial]) in SCLC patient biopsy samples (white circles) versus CDX models (black circles). CDX12 (blue) and CDX25 (pink) have a matched patient tumor biopsy generated from CTCs from those patients. (G) Experimental design to assess VM at increasing tumor volumes. A total of 12 mice were killed by the schedule 1 method between 8 and 15 weeks with tumor sizes ranging from 203 mm3 to 1135 mm3. (H) IHC of VM vessels (PAS+/CD31−, pink, black arrows) in independent CDX22P tumors ranging from 203 mm3 to 1135 mm3. Scale bar 25 μm. (I) Pearson correlation of VM vessel score versus tumor volume in CDX22P. Each circle represents an independent tumor replicate. (R = 0.5184, p = 0083). (J) Pearson correlation of EV per mm2 versus tumor volume. Each circle represents an independent tumor replicate. (K) Pearson correlation of VM vessel score versus tumor volume. Each circle represents an independent tumor replicate. (R = 0.2060, p = 0.0388). CDX, circulating tumor cell-derived explant; CTC, circulating tumor cell; DAPI, 4’,6-diamidino-2-phenylindole; EC, endothelial cell; EV, endothelial vessels; GEMM, genetically engineered mouse model; IF, immunofluorescence; IHC, immunohistochemistry; PAS, Periodic Acid Schiff stain; VM, vasculogenic mimicry.

