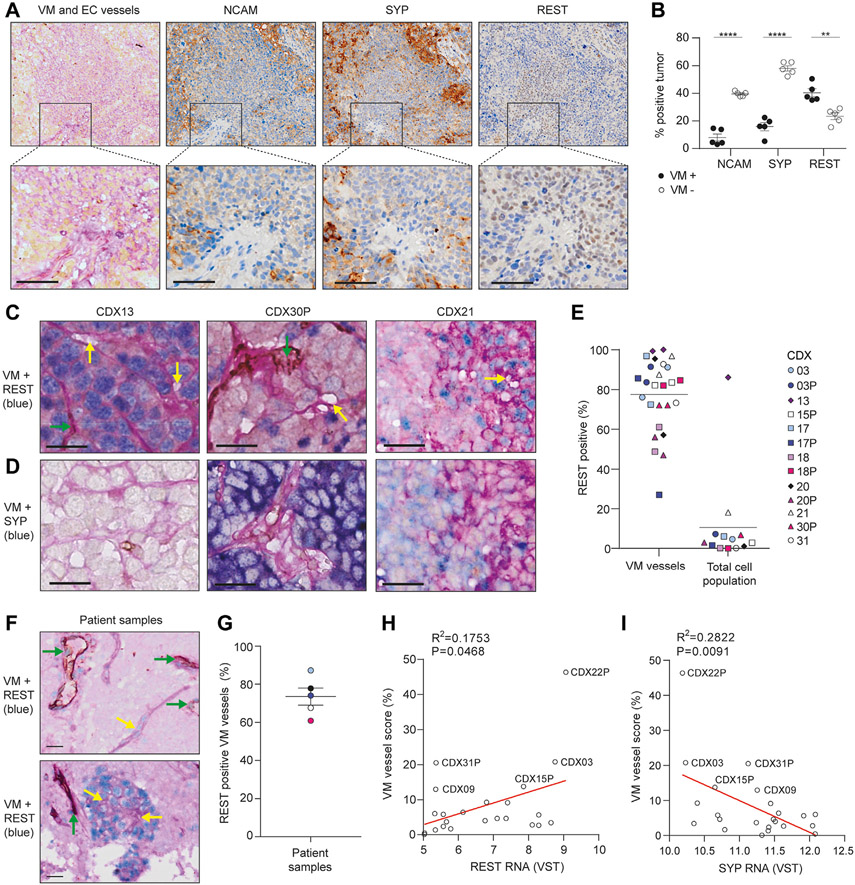
Figure 2.
VM vessels co-localize with REST+ non-NE cells. (A) IHC in serial CDX21 tissue sections for VM vessels (PAS+/CD31−, pink), endothelial vessels (PAS+/CD31+, pink+brown), REST, SYP and NCAM (brown). Scale bars, 50 μm. (B) Quantification of SYP, NCAM, and REST expression in VM-positive (black circles) and VM-negative (open circles) regions of CDX identified in (A). Each circle represents a region that was defined and quantified, and two independent mice were analyzed (n = 2 mice, n = 5 regions). Data are mean (± SEM). (C, D) Multiplex IHC showing VM vessels (PAS+/CD31−, yellow arrows), endothelial vessels (PAS+/CD31+, brown, green arrows), and REST (blue, in C) or SYP (blue, in D). Scale bars, 100 μm. (E) Percentage of VM vessels co-localized with REST (REST+ VM vessels) (n = 2 mice per CDX). Where the total REST expression for each CDX was derived from.8 Tumor sections from three independent mice per CDX were analyzed and the mean REST expression plotted. (F) Multiplex IHC illustrating VM vessels (PAS+/CD31−, yellow arrows), endothelial vessels (PAS+/CD31+, brown, green arrows), and REST (blue) in SCLC patient biopsy samples. Scale bars, 20 μm. (G) Percentage of VM vessels co-localized with REST in SCLC patient biopsy samples. n = 5 (<4% VM vessel score and <20 VM vessels per section; VM vessel scores are 9% (light blue), 5% (black), 4% (dark blue), 6% (white), and 9% (pink). (H) Pearson correlation of VM score versus REST transcript expression in CDX (R = 0.1753, p = 0.0468). The average REST expression is illustrated for three independent tumors per CDX.8 (I) Pearson correlation of VM score versus SYP transcript expression in CDX (R = 0.2822, p = 0.0091). The average SYP expression is illustrated for three independent tumors per CDX.8 CDX13 was removed from the analyses in H and I as there was a high level of VM vessels and REST expression in the tumor, which may bias the analysis. **p < 0.01, ****p < 0.0001 two-tailed unpaired Student’s t test. CDX, circulating tumor cell-derived explant; IHC, immunohistochemistry; NE, neuroendocrine; PAS, Periodic Acid Schiff stain; SEM, standard error of the mean; VM, vasculogenic mimicry.

