Figure 3.
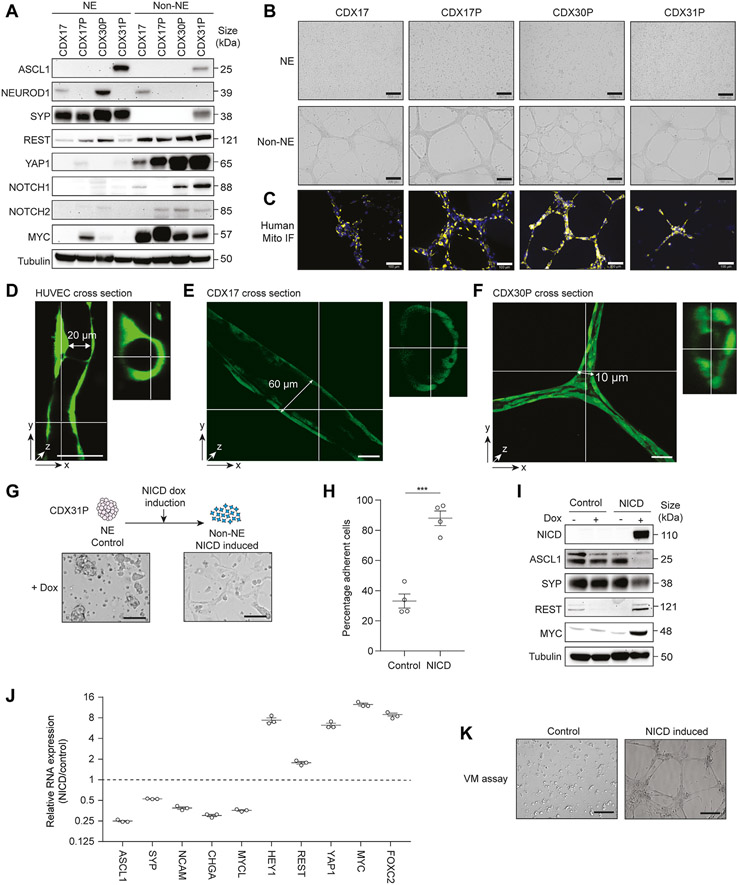
Non-NE CDX cells ex vivo are VM-competent and require NOTCH signaling. (A) Representative immunoblots of CDX NE and non-NE cell lysates. There are two to three independent replicate tumors per CDX. Tubulin loading control was run subsequently for each marker illustrated on the same blot. (B) Representative brightfield images of tubule-forming assay with CDX NE and non-NE cells. There were two to three independent replicate tumors per CDX. Scale bars, 500 μm. (C) Representative immunofluorescence of CDX non-NE cells in tubule-forming assay stained for human mitochondria (yellow) and nuclear DAPI (blue) in (B). There were two to three independent replicate tumors per CDX. Scale bars, 100 μm. (D-F) Representative images of HUVECs (D), CDX17 (E), and CDX30P (F) non-NE cells labeled with Cell Tracker Green forming hollow tubules when grown on Matrigel for 72 hours. Confocal microscopy images are illustrated after Z-stack software reconstruction (Imaris). Tubule length and diameter dimensions are illustrated, scale bars 50 μm. (G) Representative images of empty-vector control and NICD expressing CDX31P cells three weeks after dox induction. Scale bars, 250 μm. (H) Percentage of adherent cells in control versus NICD-expressing CDX31P cells three weeks after dox induction in the suspension cells (four replicates from one tumor sample). Data are mean (± SEM) (***p < 0.001 two-tailed unpaired Student’s t test. (I) Representative immunoblots in control and NICD CDX31P cells with or without dox. Tubulin loading control was run subsequently for each marker illustrated on the same blot. (J) Reverse transcription quantitative PCR analysis of NE (ASCL1, SYP, NCAm, cHgA, MYCL) and non-NE (HEY1, REST, YAP1, FOXC2, MYC) markers in control versus NICD-expressing CDX31P cells. Mean values are illustrated (black lines) in which each circle represents one independent analysis, error bars are (± SEM). (K) Representative images of tubule-forming assay with control and NICD CDX31P cells 3 weeks after dox induction. Scale bars, 200 μm. There are three independent replicate tumors. CDX, circulating tumor cell-derived explant; DAPI, 4’,6-diamidino-2-phenylindole; dox, doxycycline; HUVECs, human umbilical vein endothelial cells; NE, neuroendocrine; NICD, NOTCH 1 intracellular domain; PCR, polymerase chain reaction; SEM, standard error of the mean; VM, vasculogenic mimicry.

