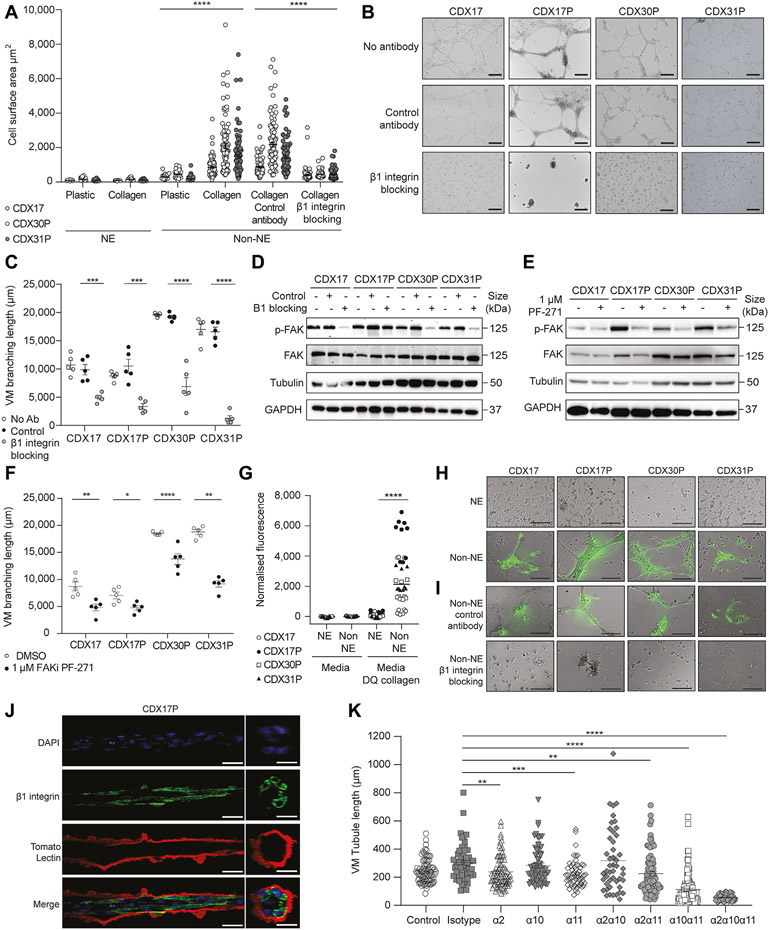
Figure 6.
Integrin β1 is required for collagen remodeling in vitro during network formation. (A) CSA of CDX (light gray circles, CDX17, open circles, CDX30P, gray circles, CDX31P) NE and non-NE cells on plastic or collagen, and treated with an integrin β1 blocking antibody or isotype control antibody. Data are mean (± SEM) 200 cells analyzed from a CDX tumor (****p < 0.0001 two-tailed unpaired Student’s t test). (B) Representative images of CDX non-NE cell tubule-forming assay with no antibody, isotype control antibody, and integrin β1 blocking antibody. Scale bars, 500 μm (n = 3 replicates per CDX tumor). (C) VM branching length of tubule-forming assays in (C). Data are mean (± SEM), five images analyzed per experiment (open circles, no antibody, black circles, isotype, gray circles, integrin β1 blocking antibody), representative of two to three replicates per CDX tumor (***p < 0.001, ****p < 0.0001 two-tailed unpaired Student’s t test). (D) Representative immunoblots of CDX non-NE cell lysates treated with no antibody, isotype control antibody, or integrin β1-blocking antibody (n = 3 replicates per CDX tumor). Each lysate was probed separately for p-FAK with tubulin as a loading control and total FAK with GAPDH as a loading control. (E) Representative immunoblots of Y397 p-FAK and FAK in CDX non-NE cell lysates treated with 1 μM FAKi PF-271 or DMSO vehicle control for 24 hours, with tubulin, and GAPDH loading controls for p-FAK and FAK, respectively (n = 3 replicates per CDX tumor). (F) VM branching length of tubule-forming assays with PF-271 treated non-NE cells (Supplementary Fig. 6E). Data are mean (± SEM) (n = 5 images analyzed per experiment) (open circles, DMSO control; black circles, 1 μM FAKi PF-271 treated cells), representative of 3 biological replicates per CDX tumor (*p < 0.05, **p < 0.005, ****p < 0.0001, two-tailed unpaired Student’s t test. (G) Fluorescence of CDX (open circles, CDX17, black circles, CDX17P, open square, CDX30P, black triangle, CDX31P) NE and non-NE cells cultured in media with or without DQ collagen. Each circle represents the fluorescence of a single well (n = 9 replicates per CDX tumor). Data are mean (± SEM) (****p < 0.0001 two-tailed unpaired Student’s t test. (H) Representative fluorescence images of tubule-forming assay with CDX NE and non-NE cells on Matrigel containing DQ collagen. Scale bars, 500 μm (n = 2 replicates per CDX tumor). (I) Representative fluorescence images of CDX non-NE cell tubule-forming assay with no antibody, isotype control antibody, and integrin β1-blocking antibody on Matrigel containing DQ collagen. Scale bars, 500 μm. (n = 2 replicates per CDX tumor). (J) Representative confocal microscopy images of CDX17P non-NE cells on Matrigel with immunofluorescent staining for DAPI nuclear stain (blue), membranous integrin β1 (green), and coated by an extracellular matrix containing lectin (tomato lectin, stained red). Images are illustrated after z-stack reconstruction using Imaris software after 72 hours on Matrigel, scale bar 50 μm. (K) VM tubule length of CDX17P non-NE cells on Matrigel treated with antibodies blocking α2-, α10-, and α11- integrins, as a single agent, in dual combinations, or combined. Individual tubule length quantified using ImageJ (****p < 0.0001). Data are mean (± SEM) (*p < 0.01, **p < 0.005, ****p < 0.0001, two-tailed unpaired Student’s t test). CSA, cell surface area; CDX, circulating tumor cell-derived explant; DMSO, dimethylsulfoxide; DQ, dye-quenched; NE, neuroendocrine; SEM, standard error of the mean; VM, vasculogenic mimicry.

