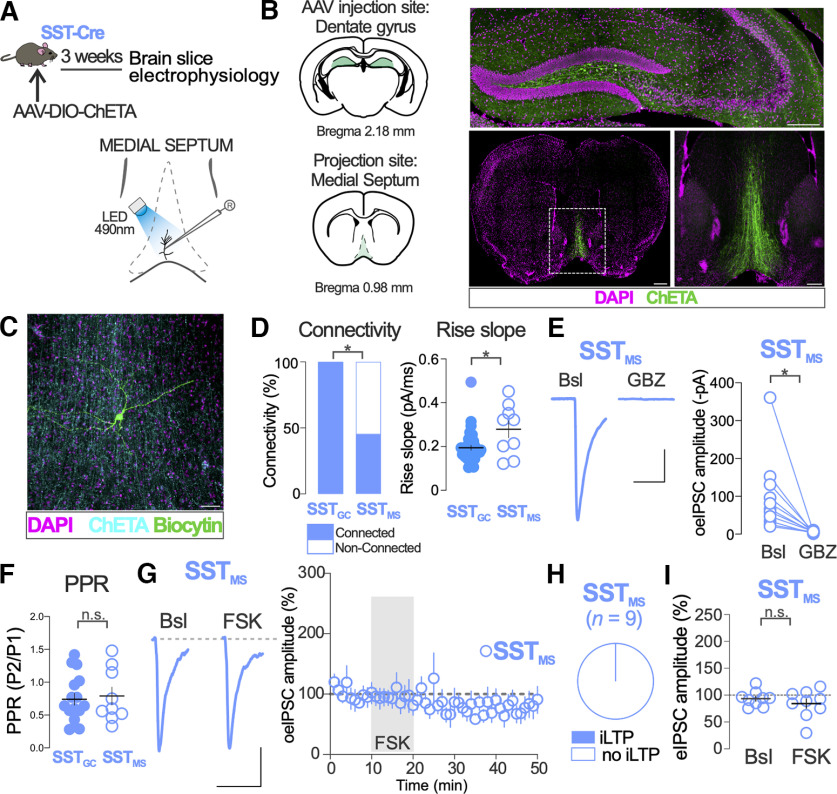
Figure 4.
Synaptic properties and PKA-dependent plasticity of DG SST IN distal synapses on medial septal neurons (SSTMS). A, Schematic of experimental procedure. B, Representative images of AAV-dependent ChETA expression in SST-Cre mice injected in the DG. Top, The injection site of AAV in the DG. Scale bar, 200 μm. Bottom, Low-magnification (scale bar: left, 500 μm) and high-magnification (scale bar: right, 200 μm) of DG SST IN long-range projections in the MS. Anatomical diagrams approximately corresponding to the images shown are adapted from Paxinos and Franklin (2012). C, Representative image of medial septum slice showing a biocytin-filled MS neuron (green). Long-range axonal projections from hilar ChETA expressing SST IN are shown in cyan. Scale bar, 50 μm. D, Connectivity and rise slope comparison between distal SSTMS and local SSTGC synapses. Connectivity: two-sided Fisher’s exact test, p < 0,001; rise slope: two-sided Mann–Whitney test: U = 89.5, p = 0.04; SSTGC, n = 36 synapses; SSTMS, n = 9 synapses. E, The GABAA receptor blocker gabazine (GBZ) blocks oeIPSC responses in MS neurons to SSTMS synapses optogenetic stimulation. Two-sided Mann–Whitney test: U = 0, p < 0.0001. Calibration: 100 pA, 50 ms. F, The PPR of SSTMS and SSTGC oeIPSCs did not differ. Two-sided Mann–Whitney test: U = 71, p = 0.97; SSTGC, n = 16 synapses; SSTMS, n = 9 synapses. G, Representative traces of SSTMS oeIPSCs before (Bsl) and after FSK bath application. Calibration: 50 pA, 50 ms. The time course of FSK effect on normalized SSTMS oeIPSC amplitude is shown in the right graph. H, Proportion of recorded MS neurons showing a significant increase of eIPSC amplitude after FSK application. I, Population data of FSK effects on normalized SSTMS oeIPSC amplitude before (Bsl) and after FSK application. Two-sided t test: t(16) = 0.93, p = 0.37; MS neurons, n = 9. *p < 0.05; n.s., nonsignificant. Dots in D, E, F, and I represent individual measurements. Horizontal and vertical bars in D and I, and circles and vertical bars in G represent the mean ± SEM.

