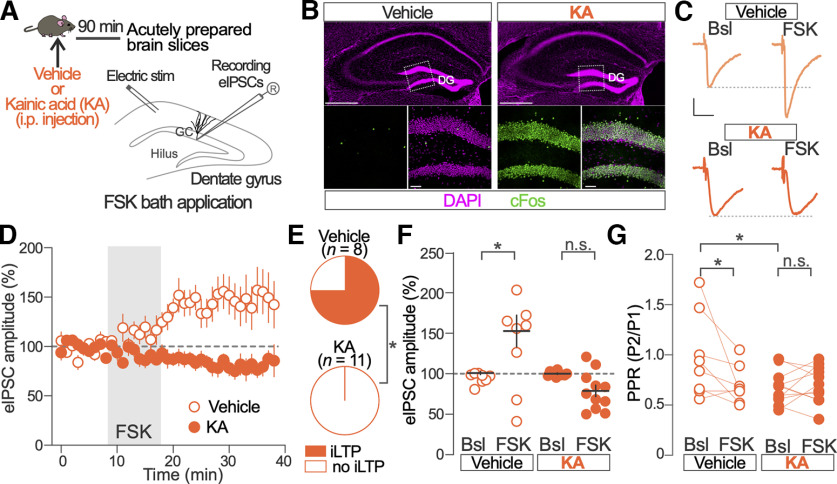
Figure 5.
Kainic acid-induced increases in synaptic activity prevent the induction of iLTP in GCs. A, Schematic of experimental procedure. B, Representative example of c-Fos (green) expression in the DGs of vehicle- and KA-injected mice. Boxed regions in top panels are shown in bottom panels. Scale bars: top, 500 μm; bottom, 50 μm. C, Representative traces of eIPSCs before (Bsl) and after FSK bath application recorded from GCs in vehicle- and KA-treated mice. Calibration: 25 ms, 50 pA. D, Time course of FSK effects on normalized eIPSC amplitude in GCs from vehicle- and KA-treated mice. Vehicle-injected mice, n = 8 GCs; KA-injected mice, n = 11 GCs. E, Proportion of recorded GCs showing a significant increase of eIPSC amplitude after FSK application in the vehicle- and KA-treated mice. Two-sided Fisher’s exact test, p = 0.001; vehicle-treated mice, n = 8 GCs; KA-injected mice, n = 11 GCs. F, Population data of FSK effects on normalized eIPSC amplitude before (Bsl) and after FSK application in GCs from vehicle- and KA-injected mice. Two-way ANOVA; Vehicle versus KA: F(1,17) = 15.85, p = 0.001; Bonferroni’s multiple-comparisons test; Vehicle Bsl versus FSK, p = 0.004; KA Bsl versus FSK, p = 0.19; vehicle-treated mice, n = 8 GCs; KA-injected mice, n = 11 GCs. G, Population data for eIPSC PPR calculated before (Bsl) and after FSK application in GCs from vehicle- and KA-injected mice. Two-way ANOVA; Vehicle versus KA: F(1,17) = 2.43, p = 0.14; Bonferroni’s multiple-comparisons test; vehicle Bsl versus FSK, p = 0.02; KA Bsl versus FSK, p = 0.99; Bsl Vehicle versus KA, p = 0.02; vehicle-treated mice, n = 8; KA-injected mice, n = 11 GCs. *p < 0.05; n.s., nonsignificant. Dots and vertical bars in D and horizontal and vertical bars in F represent the mean ± SEM. Dots in F and G represent individual measurements.

