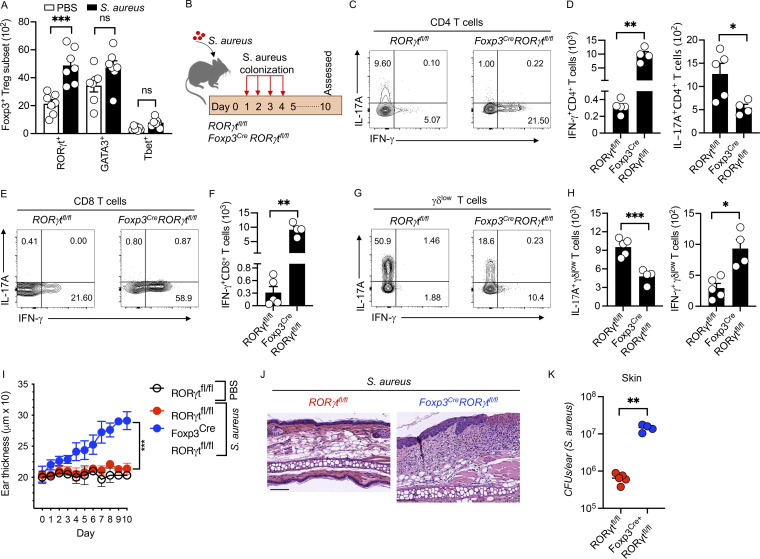
Figure 6.
RORγt+Foxp3+ Tregs control type 1 immune responses. (A) Absolute numbers of Foxp3+ Tregs expressing the transcription factor RORγt, GATA3, or T-bet in PBS control and S. aureus–colonized mice. Wild-type mice were colonized with S. aureus on days 1–4 and euthanized on day 10 for analysis. Mean ± SEM from two experiments with seven mice per group. (B) Schematic representation of S. aureus colonization protocol in RORγtfl/fl and Foxp3creRORγtfl/fl mice. Mice were colonized with S. aureus on days 1–4 and euthanized on day 10 for analysis. (C) Flow cytometry analysis of IL-17A and IFN-γ production from CD4+ T cells in S. aureus–colonized RORγtfl/fl and Foxp3creRORγtfl/fl mice. Representative of two experiments with four to five mice per group. Numbers in contour plots indicate the percent of cells within the gates. (D) Absolute numbers of IFN-γ+CD4+ and IL-17A+CD4+ T cells in S. aureus–colonized RORγtfl/fl and Foxp3creRORγtfl/fl mice. Mean ± SEM from two experiments with four to five mice per group. (E) Flow cytometry analysis of IL-17A and IFN-γ production from CD8+ T cells in S. aureus–colonized RORγtfl/fl and Foxp3creRORγtfl/fl mice. Representative of two experiments with four to five mice per group. Numbers in contour plots indicate the percent of cells within the gates. (F) Absolute numbers of IFN-γ+CD8+ T cells in S. aureus–colonized RORγtfl/fl and Foxp3creRORγtfl/fl mice. Mean ± SEM from two experiments with four to five mice per group. (G) Flow cytometry analysis of IL-17A and IFN-γ production from γδlow T cells in S. aureus–colonized RORγtfl/fl and Foxp3creRORγtfl/fl mice. Representative of two experiments with four to five mice per group. Numbers in contour plots indicate the percent of cells within the gates. (H) Absolute numbers of IL-17A+γδlow T cells and IFN-γ+γδlow T cells in S. aureus–colonized RORγtfl/fl and Foxp3creRORγtfl/fl mice. Mean ± SEM from two experiments with four to five mice per group. (I) Ear thickness measurement of PBS control and S. aureus–colonized RORγtfl/fl and Foxp3creRORγtfl/fl mice. (J) H&E-stained sections of S. aureus–colonized RORγtfl/fl and Foxp3creRORγtfl/fl mice. Scale bar = 200 μm. Mean ± SD representative of two experiments with three to five mice per group. (K) CFUs of S. aureus–colonized RORγtfl/fl and Foxp3creRORγtfl/fl mice on day 10. Mean ± SEM representative of two experiments with four to five mice per group. *P < 0.05, **P < 0.01, and ***P < 0.001. “ns” denotes not significant. Significant P values by two-tailed unpaired Student’s t test with Welch’s correction, except for A, which is one-way ANOVA with Tukey’s multiple comparisons test, are indicated in the figure.

