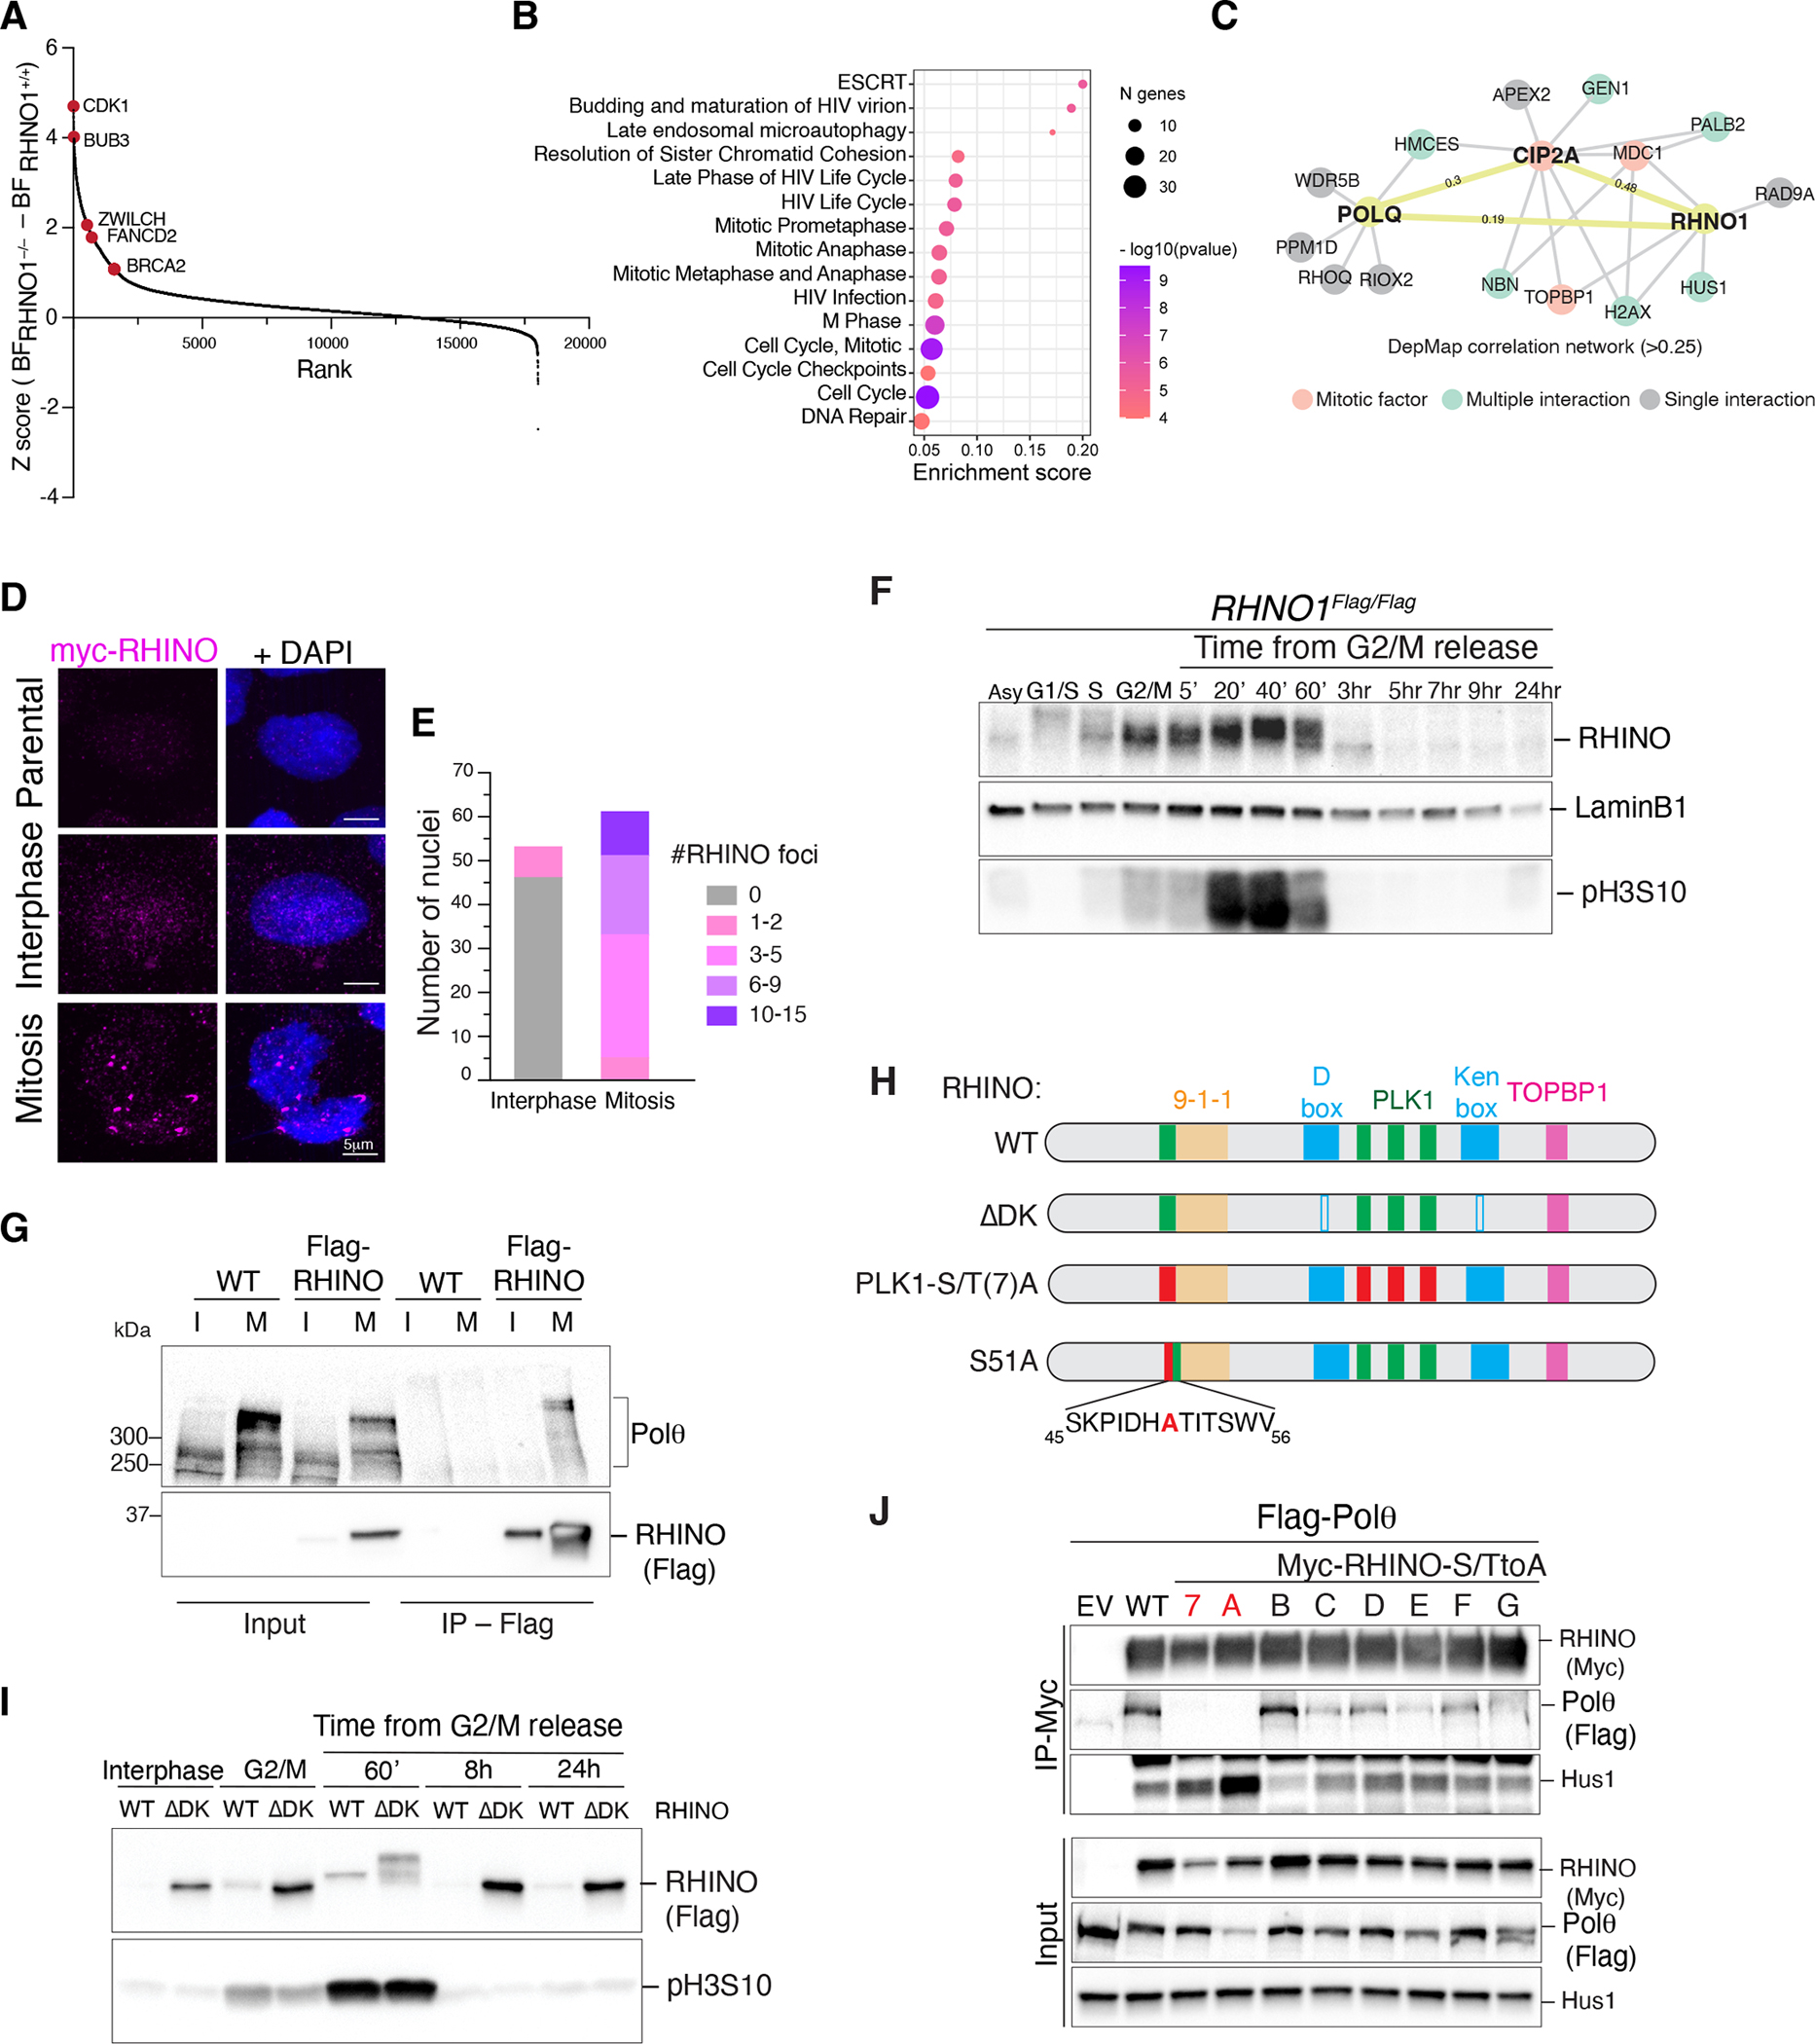
Fig. 3. RHINO is predominantly expressed in mitosis.

(A) Results from the CRISPR/Cas9 dropout screen in RHNO1−/− and isogenic RHNO1+/+ cells. Ranked z-scores of the difference in Bayes factor (BF) scores. (B) Reactome pathway overrepresentation analysis of synthetic lethal genes with RHNO1−/−. The fold enrichment of each pathway is plotted on the x-axis. The number of associated genes with each pathway is indicated by the size of the circle, while the color shade indicates the p-value. (C) Network analysis for POLQ and RHNO1 based on Pearson’s correlation of dependency scores derived from DepMap. (D) Representative immunofluorescence images of RHINO in interphase and mitotic cells. (E) Quantification of RHINO foci from panel D. (F) Western blot analysis of endogenous RHINO at different stages of the cell cycle. Extracts from RHNO1FLAG/FLAG cells at the indicated time points. pH3S10 antibody is used as a mitotic marker, and Lamin B1 as a loading control. (G) Control cells and ones expressing RHINO-MYC-FLAG were synchronized in mitosis and subjected to anti-FLAG immunoprecipitation followed by western blot for endogenous Polθ. I = interphase; M = mitosis. (H) Schematic of RHINO protein highlighting the binding domains for 9-1-1 and TOPBP1, D- and Ken-boxes (ΔDK), and the PLK1 phosphorylation sites (PLK1(S/T)7A and S51A). RHINO PLK1(S/T)A harbors alanine mutations in all 7 predicted PLK1 sites. RHINO S51A harbors a single mutation of serine 51 (conserved among primates and rodents) to alanine. (I) Western blot analysis of RHINO and RHINOΔDK during the cell cycle. (J) Co-IP experiments in HEK293T cells co-transfected with plasmids expressing FLAG-Polθ and RHINO-MYC mutants. RHINO mutants with a single S/T mutation to alanine are A through G.
