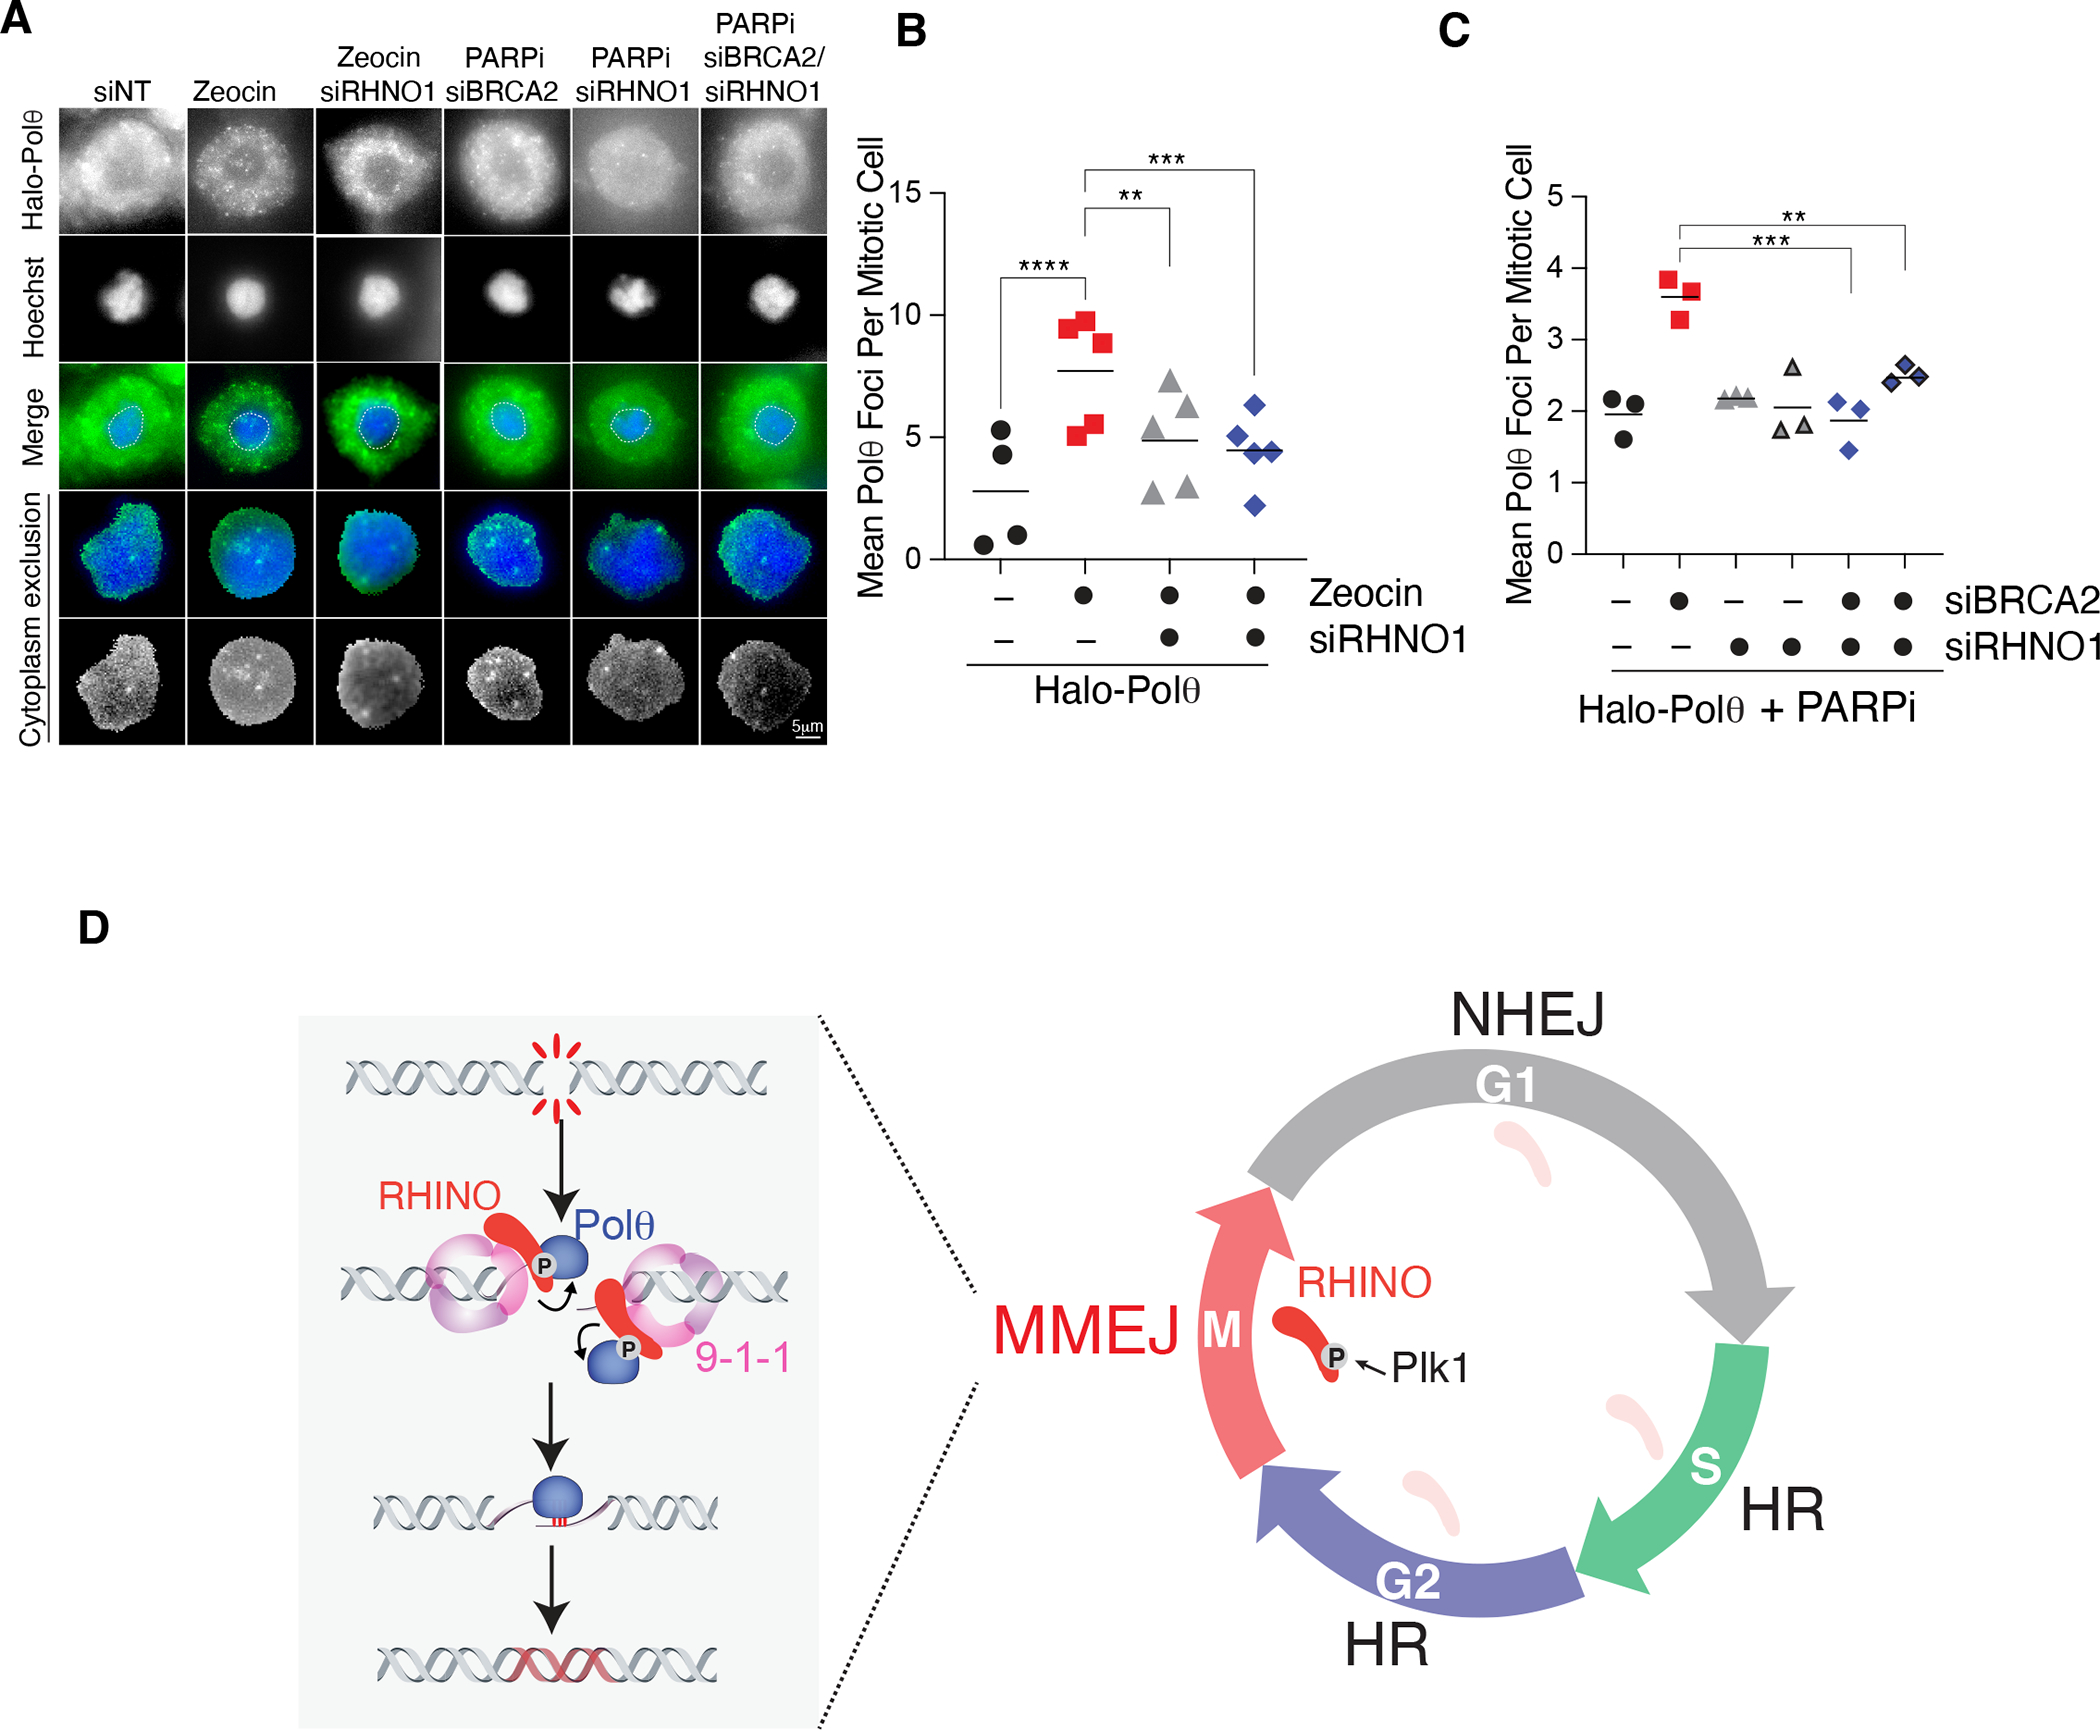
Fig. 5. RHINO recruits Polθ to damaged sites in mitosis.

(A) Representative images of Halo-Polθ foci in mitosis. Cells with the indicated siRNA treatment were synchronized according to the scheme in Fig. 4A. Cells in mitosis were treated with Zeocin for 1 hour. To monitor mitotic Polθ foci in cells with persistent damage from S phase, cells expressing siRNA against BRCA2 and RHNO1 were treated with Olaparib according to the schematic in Fig. 4F. (B) Quantification of mitotic Halo-Polθ foci in live-cells treated with Zeocin and depleted of RHNO1. Bars represent the mean of three independent experiments. n>40 nuclei (one-way ANOVA (***p<0.001, **p<0.01)). (C) Quantification of mitotic Halo-Polθ foci in live-cell imaging experiments in nocodazole-arrested cells treated with PARPi during S phase. Bars represent the mean of three independent experiments (n>40 nuclei; one-way ANOVA; ***p<0.001, **p<0.01). (D) NHEJ dominates in G1, and HR is preferred in S and G2. The confinement of MMEJ to mitosis occurs due to the accumulation of RHINO during M phase, PLK1- phosphorylation, and the recruitment of Polθ to DNA breaks
