
FIGURE 1.
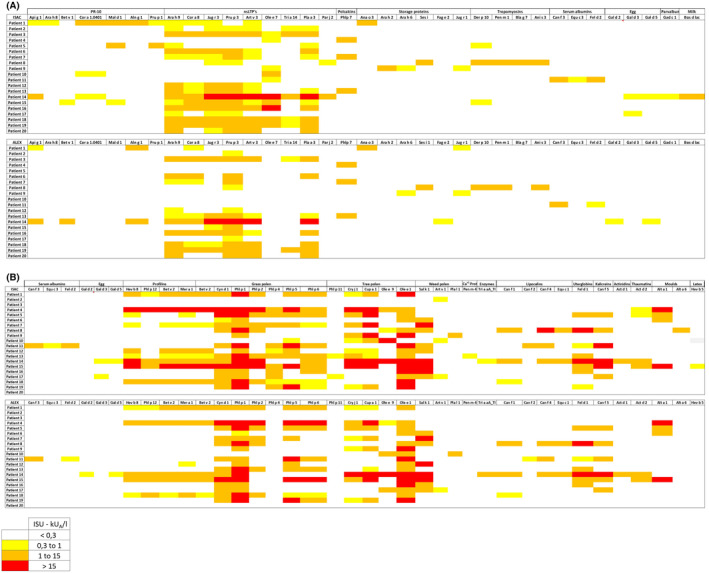
(A) Heatmap corresponding to the sensitization profiles of the 20 study patients according to ALEX and ImmunoCAP ISAC. The heatmap displays only allergens shared between both platforms with at least a positive result in either of the two platforms. Allergens are grouped by protein families. (B) Heatmap corresponding to the sensitization profiles of the 20 study patients according to ALEX and ImmunoCAP ISAC. The heatmap displays only allergens shared between both platforms with at least a positive result in either of the two platforms. Allergens are grouped by protein families.