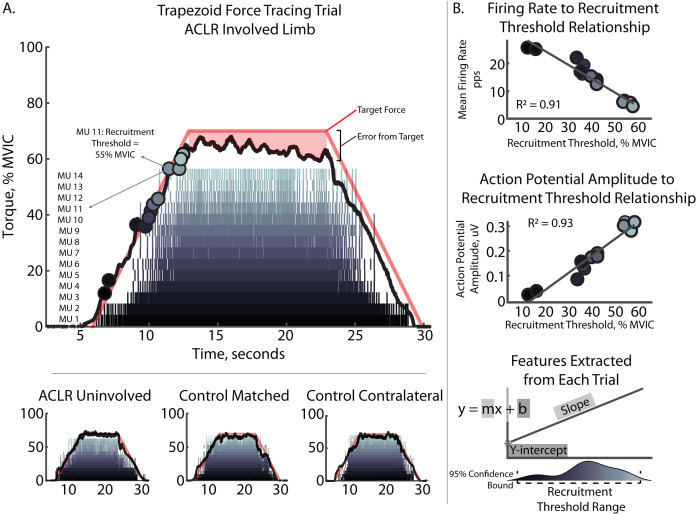
Figure 1. Characteristic trapezoidal contraction and MU decomposition.
(A) Depicts characteristic trapezoidal contraction and MU decomposition at 70% intensity. Raster plot shows each individual MU Firing with MU number displayed at the left. Solid black line depicts torque output relative to peak torque output during MVIC trial (% MVIC). Colored circles on torque output represent recruitment threshold for corresponding MU. Solid red line depicts visual feedback of target shape with 7 s ramp and 10 s plateau periods. Mean firing rate were taken from the plateaued region. Mean torque and normalized root mean square error were quantified as average torque and the degree of error from the target line during the plateau. Subplots contains additional examples for other limb and groups comparators. (B) Depicts participant specific regressions and feature extraction of recruitment threshold range, slopes, and y-intercepts for the mean firing rate to recruitment threshold and action potential amplitude to recruitment threshold relationships. ACLR, anterior cruciate ligament reconstruction; MVIC, maximum voluntary isometric contraction; MU, motor unit; pps, pulses per second; uV, microvolts.

