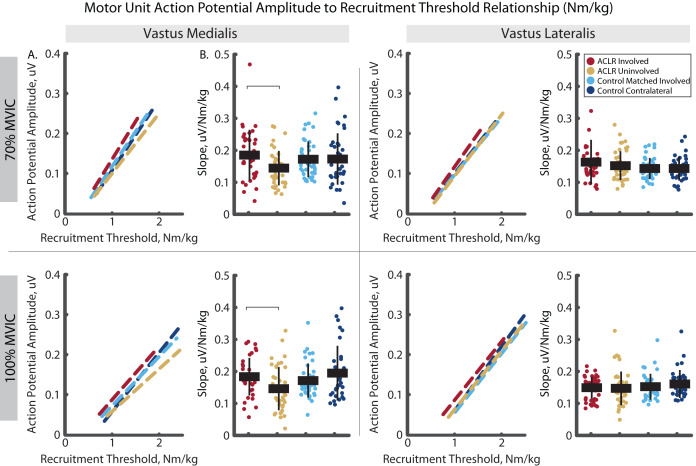
Figure 8. Motor unit action potential amplitude to mass-normalized recruitment threshold slope comparisons for MUs identified in the vastus medialis and vastus lateralis during the 70% and 100% trials.
(A) Dashed lines represent the action potential amplitude to recruitment threshold relationship across the group*limb levels. Lines are plotted with average slopes and mass–normalized recruitment threshold ranges without controlling for y-intercept. (B) Individual circles depict the predicted value from the mixed effect model. Solid horizontal bars represent the least squared means and vertical error bars are the standard deviation. Post hoc comparisons that reached statistical significance are denoted with brackets. ACLR, anterior cruciate ligament reconstruction; MVIC, maximum voluntary isometric contraction; Nm/kg, Newton-meter per kilogram; uV, microvolts.

