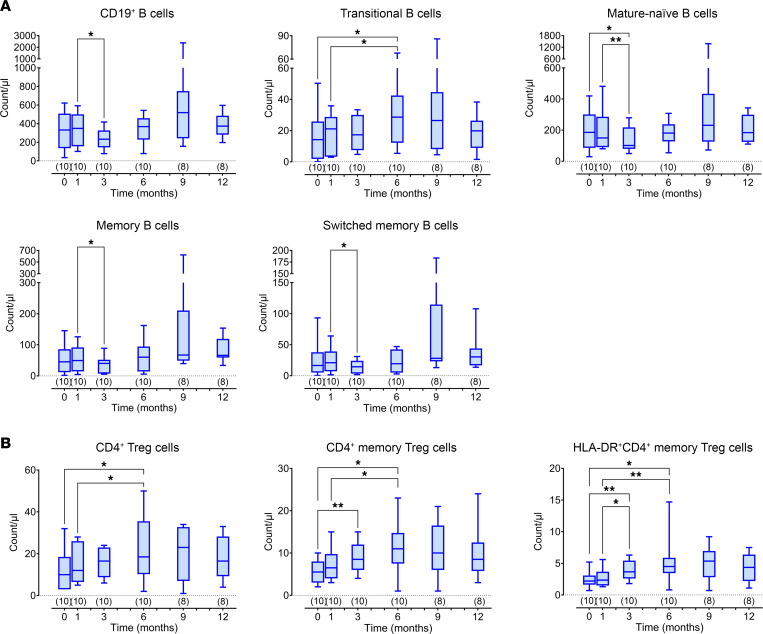
Figure 4. Pediatric immunomonitoring results.
(A) Total CD19+ B cells and B cell subpopulations at baseline and at 1, 3, 6, 9, and 12 months from BM-MSC infusions. Numbers of available samples at different time points are indicated in parentheses (n). Differences between groups were compared using the paired Wilcoxon’s test. *P < 0.05; **P < 0.01. (B) Total, memory, and HLA-DR+ memory Treg cells at baseline and at 1, 3, 6, 9, and 12 months from BM-MSC infusions. Numbers of available samples at different time points are indicated in parentheses (n). All box-and-whisker plots represent the median and the 25th and 75th centiles; error bars represent the smallest and the largest values. Within-group differences were compared using paired Wilcoxon’s signed-rank test. *P < 0.05; **P < 0.01.

