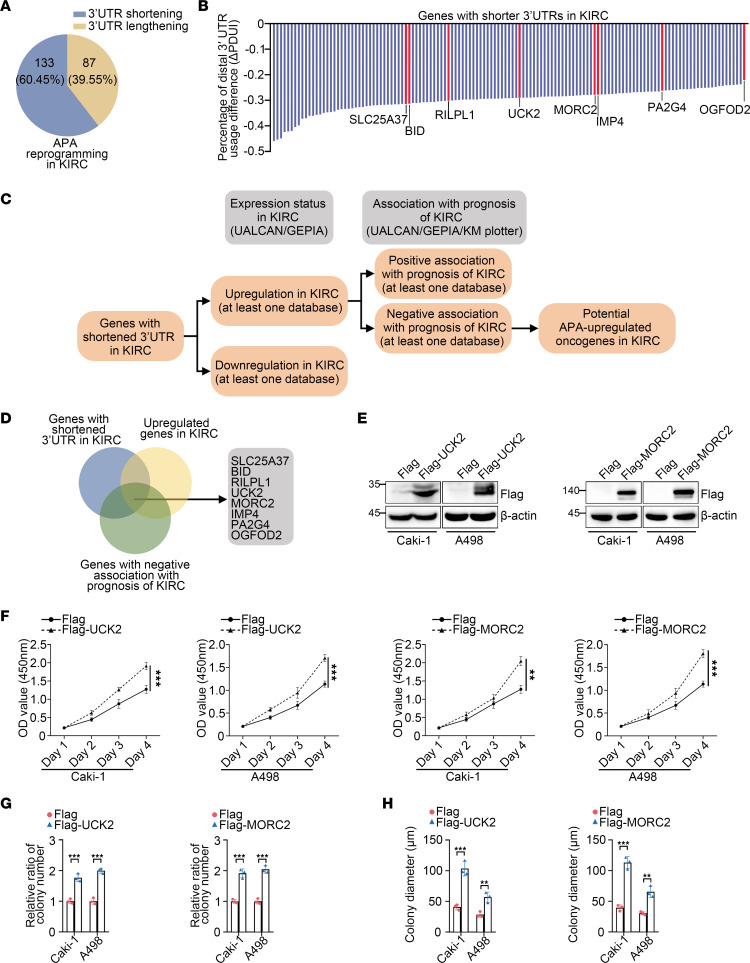
Figure 1. Among the genes with shortened 3′UTRs in KIRC, UCK2 and MORC2 gain oncogenic potential.
(A) The diagram indicating the composition of 3′UTR reprogramming in KIRC. (B) The quantitative summary of genes with shortened 3′UTRs in KIRC. (C) The sketch map indicating the procedure of bioinformatic analysis to identify potential oncogenes of KIRC. (D) The Venn diagram indicating the potential oncogenes among genes with shortened 3′UTRs in KIRC. (E) Immunoblotting was performed to evaluate the expression of Flag-UCK2 and Flag-MORC2 in Caki-1 and A498 cells transfected with empty Flag vector, Flag-UCK2, or Flag-MORC2 plasmid. (F) CCK8 assays were performed to evaluate the proliferation rate of Caki-1 cells and A498 cells transfected with empty Flag vector, Flag-UCK2, or Flag-MORC2 plasmid (n = 3). (G) Colony formation assays were performed and quantitatively analyzed to evaluate the clonogenicity of Caki-1 cell and A498 cells transfected with empty Flag vector, Flag-UCK2, or Flag-MORC2 plasmid (n = 3). (H) Soft agar assays were performed and quantitatively analyzed to evaluate the clonogenicity of Caki-1 cell and A498 cells transfected with empty Flag vector, Flag-UCK2, or Flag-MORC2 plasmid (n = 3). All data represent the mean ± SD. Two-tailed t test analyses were performed. **P < 0.01; ***P < 0.001.

