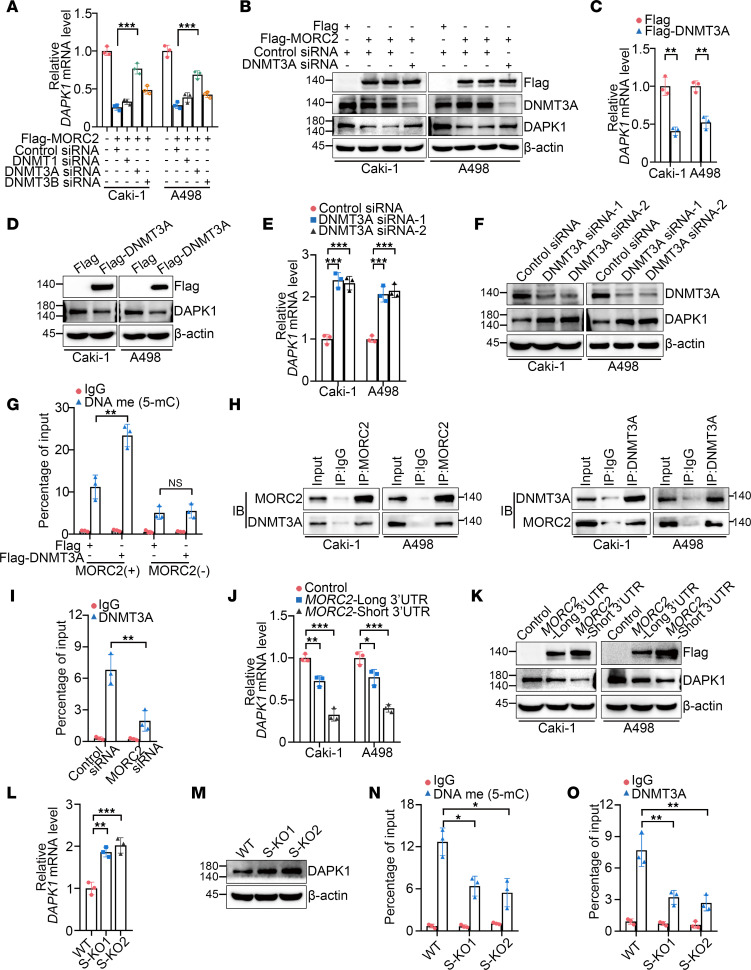
Figure 6. 3′UTR shortening of MORC2 amplifies promoter methylation and downregulation of DAPK1 via enhancing DNMT3A recruitment.
(A and B) qPCR (A) and immunoblotting (B) were performed to evaluate DAPK1 expression in KIRC cells transfected with Flag vector or Flag-MORC2 with silencing of indicated gene respectively (n = 3). (C and D) qPCR (C) and immunoblotting (D) were performed to evaluate DAPK1 expression in KIRC cells transfected with Flag vector or Flag-DNMT3A (n = 3). (E and F) qPCR (E) and immunoblotting (F) were performed to evaluate DAPK1 expression in KIRC cells transfected with control or DNMT3A-specific siRNA (n = 3). (G) MeDIP-qPCR was performed to evaluate promoter methylation level of DAPK1 in WT and MORC2-depleted Caki-1 cells transfected with Flag vector or Flag-DNMT3A (n = 3). (H) Co-IP was performed to detect the interaction between MORC2 and DNMT3A in KIRC cells. (I) ChIP-qPCR was performed to determine the abundance of DNMT3A at the DAPK1 promoter in Caki-1 cells transfected with control or MORC2-specific siRNA (n = 3). (J and K) qPCR (J) and immunoblotting (K) were performed to evaluate DAPK1 expression in KIRC cells transfected with vector, short 3′UTR, or long 3′UTR MORC2 plasmid (n = 3). (L and M) qPCR (L) and immunoblotting (M) were performed to evaluate DAPK1 expression in WT and S-KO Caki-1 cells (n = 3). (N) MeDIP-qPCR was performed to evaluate promoter methylation level of DAPK1 in WT and S-KO Caki-1 cells (n = 3). (O) ChIP-qPCR was performed to determine the abundance of DNMT3A at the DAPK1 promoter in WT and S-KO Caki-1 cells (n = 3). All data represent the mean ± SD. Two-tailed t test, 1-way ANOVA with Tukey multiple-comparison test, or 2-way ANOVA with Tukey multiple-comparison test analyses were performed. *P < 0.05; **P < 0.01; ***P < 0.001.

