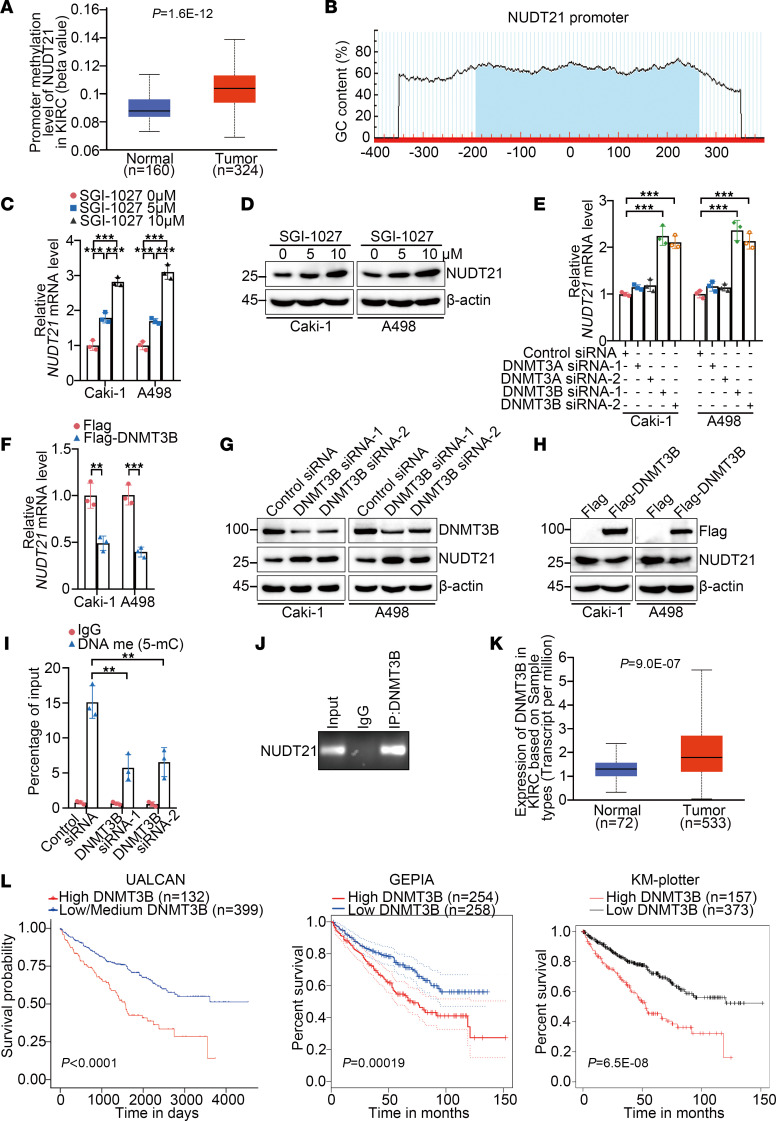
Figure 8. DNMT3B-induced promoter methylation downregulates NUDT21 in KIRC.
(A) The promoter methylation levels of DAPK1 in KIRC tissues and matched normal kidney tissues were analyzed with the UALCAN database. (B) Graph indicating the position of the CpG island at the DAPK1 promoter. (C) qPCR was performed to evaluate expression of DAPK1 in Caki-1 and A498 cells treated with SGI-1027 (n = 3). (D) Immunoblotting was performed to evaluate expression of DAPK1 in Caki-1 and A498 cells treated with SGI-1027. (E) qPCR was performed to evaluate expression of DAPK1 in Caki-1 and A498 cells transfected with control, DNMT3A-specific, or DNMT3B-specific siRNAs (n = 3). (F) qPCR was performed to evaluate expression of DAPK1 in Caki-1 and A498 cells transfected with empty Flag vector or Flag-DNMT3B (n = 3). (G) Immunoblotting was performed to evaluate expression of DAPK1 in Caki-1 and A498 cells transfected with control siRNA or DNMT3B-specific siRNAs. (H) Immunoblotting was performed to evaluate expression of DAPK1 in Caki-1 and A498 cells transfected with empty Flag vector or Flag-DNMT3B. (I) MeDIP-qPCR was performed to evaluate promoter methylation level of DAPK1 in Caki-1 cells transfected with empty Flag vector or Flag-DNMT3B (n = 3). (J) ChIP-PCR was performed to detect the binding of DNMT3B to promoter of DAPK1 in Caki-1 cells (n = 3). (K) The mRNA levels of DNMT3B in KIRC tissues and matched normal kidney tissues were analyzed with UALCAN database. (L) Prognosis association of DNMT3B in KIRC was analyzed with UALCAN (left), GEPIA (middle), and KM plotter (right) Databases. All data represent the mean ± SD. Two-tailed t test, 1-way ANOVA with Tukey multiple-comparison test, or 2-way ANOVA with Tukey multiple-comparison test analyses were performed. **P < 0.01; ***P < 0.001.

